#bitcoin
📊 $BTC /USDT: Breakout to $96K or Pullback to $82K? Market Analysis
Bitcoin is trading around $84.7K following a strong recovery from summer lows of $60K. The market structure shows an upward trend, yet the price has reached a key resistance cluster.
🔑 Key Technical Levels
➡️ Resistance Zone ($86K – $88K): The main hurdle for buyers. A clean breakout and consolidation above $88K would pave the way to the next target at $96K.
➡️ Short-term Support ($82K): The lower boundary of the current sideways range. Losing this level could trigger a deeper correction.
➡️ Major Support Block ($74K – $78K): A previous consolidation zone that serves as strong defense for the bulls in the event of a pullback.
📈 What Do Indicators and On-Chain Data Say?
1. 4-Hour Timeframe: The price is squeezed within the $82K–$86K range. The RSI is hovering around 50 (neutral zone), confirming a balance of power between buyers and sellers.
2. Moving Averages (MA): The 100-day MA is rising sharply and approaching the 200-day MA near $72K. A bullish crossover (Golden Cross) could act as an additional driver for a move above $90K.
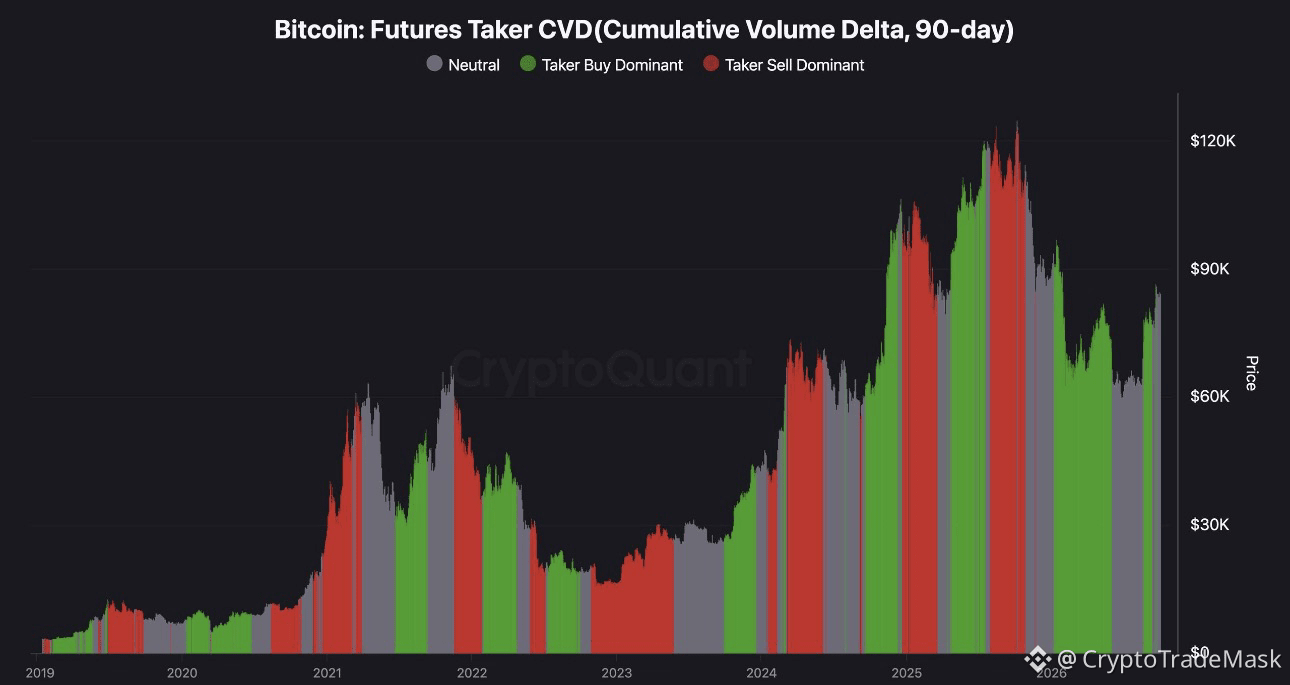
3. Futures Taker CVD (90d): The indicator has returned to the green zone, signaling that aggressive buying is once again dominating the futures market.
⚠️ An important detail: Buying activity is evident in the spot market just below the $86K level. If this buying pressure successfully breaks through that resistance, the upward momentum will accelerate. Conversely, if the price stalls, it would indicate that large sellers are fully absorbing the demand.
🎯 Summary: The market is in a phase of critical consolidation. Key levels to watch in the coming days are $86K (for a potential upside breakout) and $82K (to see if support holds).
📊 $BTC /USDT: Breakout to $96K or Pullback to $82K? Market Analysis
Bitcoin is trading around $84.7K following a strong recovery from summer lows of $60K. The market structure shows an upward trend, yet the price has reached a key resistance cluster.
🔑 Key Technical Levels
➡️ Resistance Zone ($86K – $88K): The main hurdle for buyers. A clean breakout and consolidation above $88K would pave the way to the next target at $96K.
➡️ Short-term Support ($82K): The lower boundary of the current sideways range. Losing this level could trigger a deeper correction.
➡️ Major Support Block ($74K – $78K): A previous consolidation zone that serves as strong defense for the bulls in the event of a pullback.
📈 What Do Indicators and On-Chain Data Say?
1. 4-Hour Timeframe: The price is squeezed within the $82K–$86K range. The RSI is hovering around 50 (neutral zone), confirming a balance of power between buyers and sellers.
2. Moving Averages (MA): The 100-day MA is rising sharply and approaching the 200-day MA near $72K. A bullish crossover (Golden Cross) could act as an additional driver for a move above $90K.
3. Futures Taker CVD (90d): The indicator has returned to the green zone, signaling that aggressive buying is once again dominating the futures market.
⚠️ An important detail: Buying activity is evident in the spot market just below the $86K level. If this buying pressure successfully breaks through that resistance, the upward momentum will accelerate. Conversely, if the price stalls, it would indicate that large sellers are fully absorbing the demand.
🎯 Summary: The market is in a phase of critical consolidation. Key levels to watch in the coming days are $86K (for a potential upside breakout) and $82K (to see if support holds).