🔥 Brief analysis of $API3 /USDT
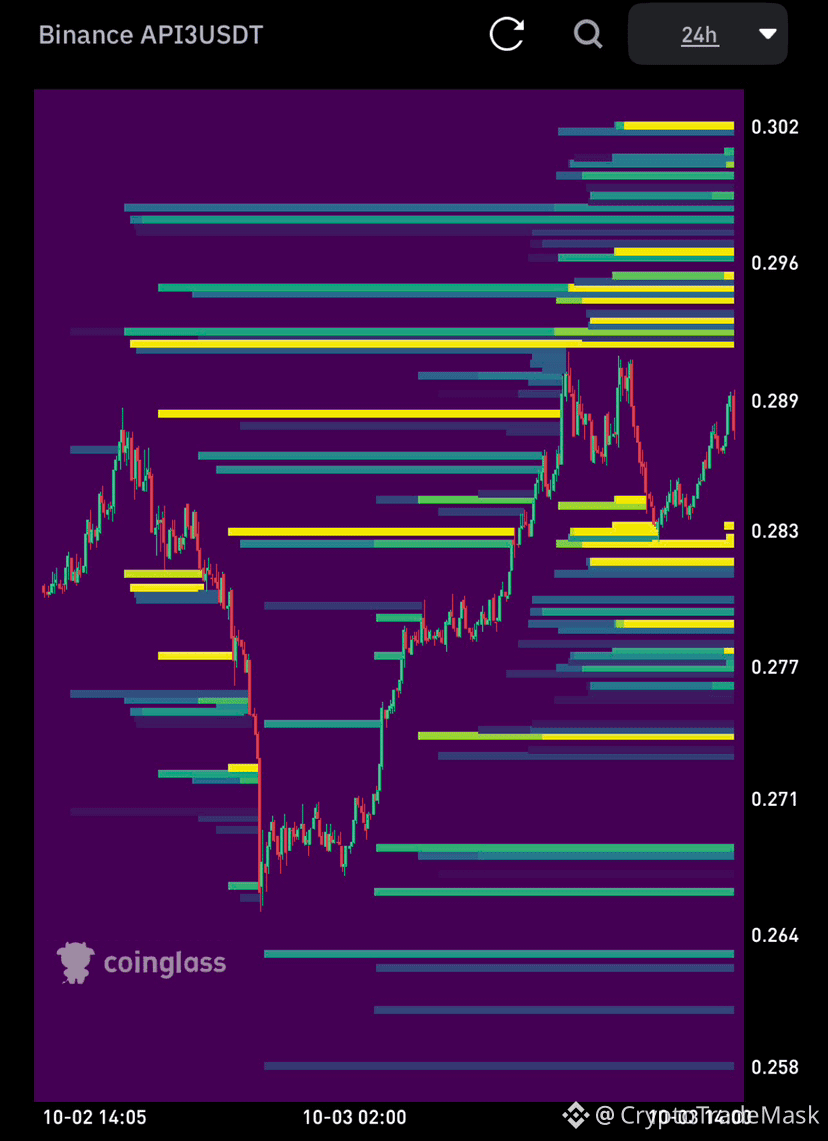
The price is recovering after a drop to $0.2655 but is approaching a strong resistance zone at $0.292–$0.296, where seller liquidity pools are concentrated.
📊 Key observations:
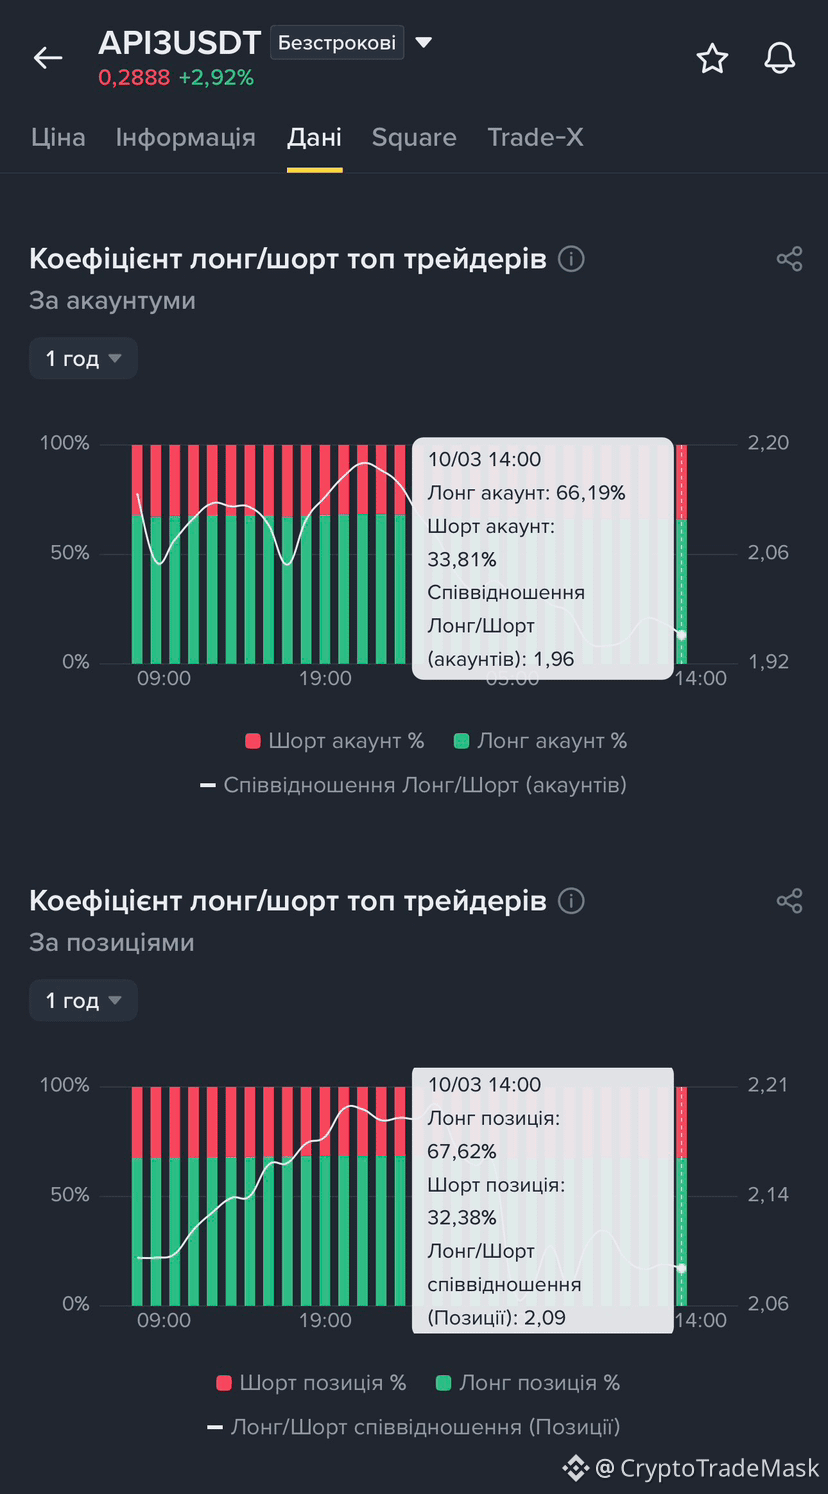
Market sentiment: ~67% of retail accounts are Long. Such a high bias often acts as a trap and a counter-trend signal.
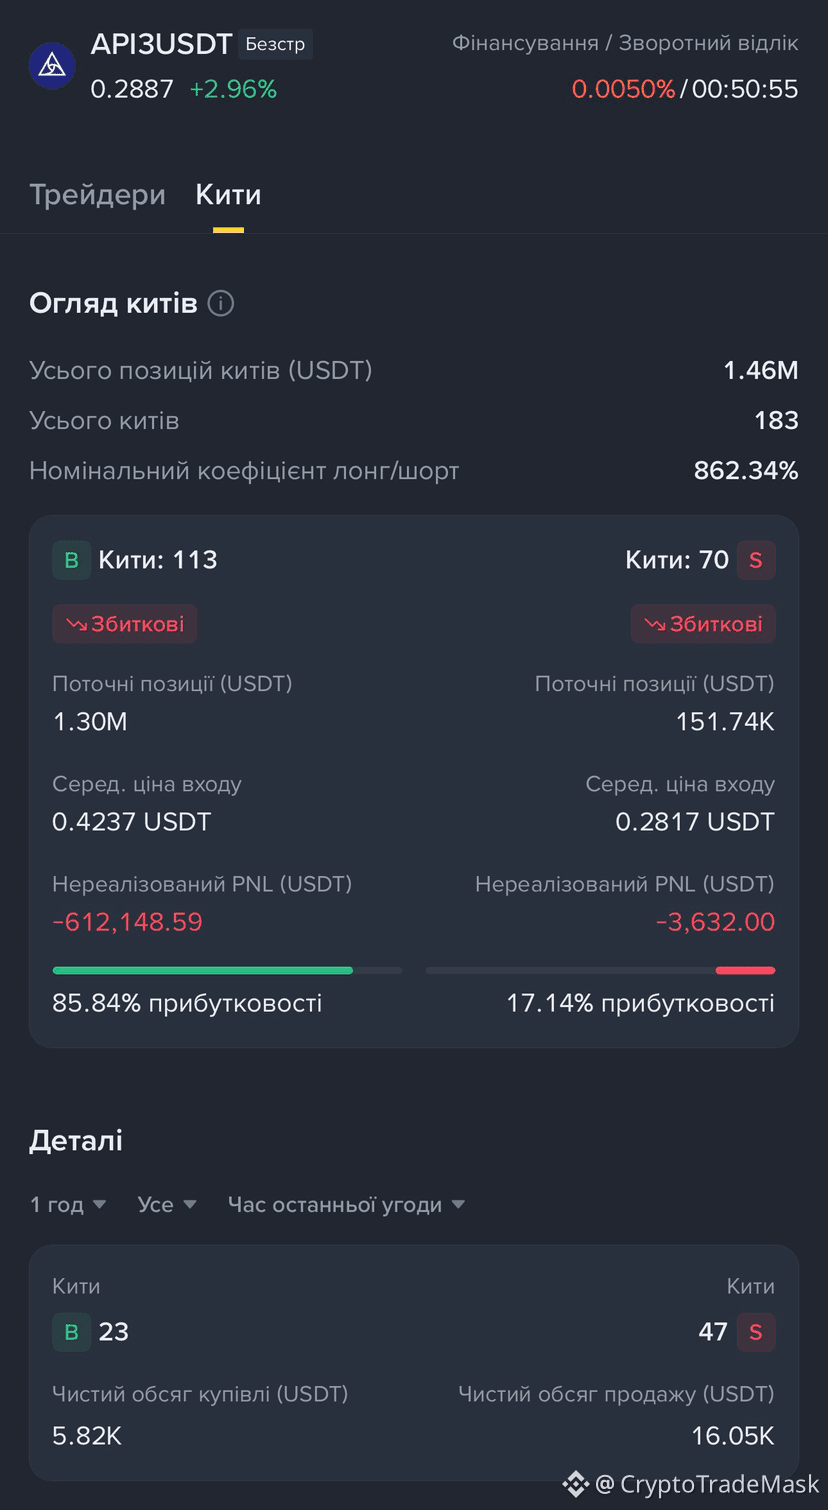
Whale activity: Over the last 60 minutes, large players have been primarily selling (net sell of $16K vs. $5.8K buy).
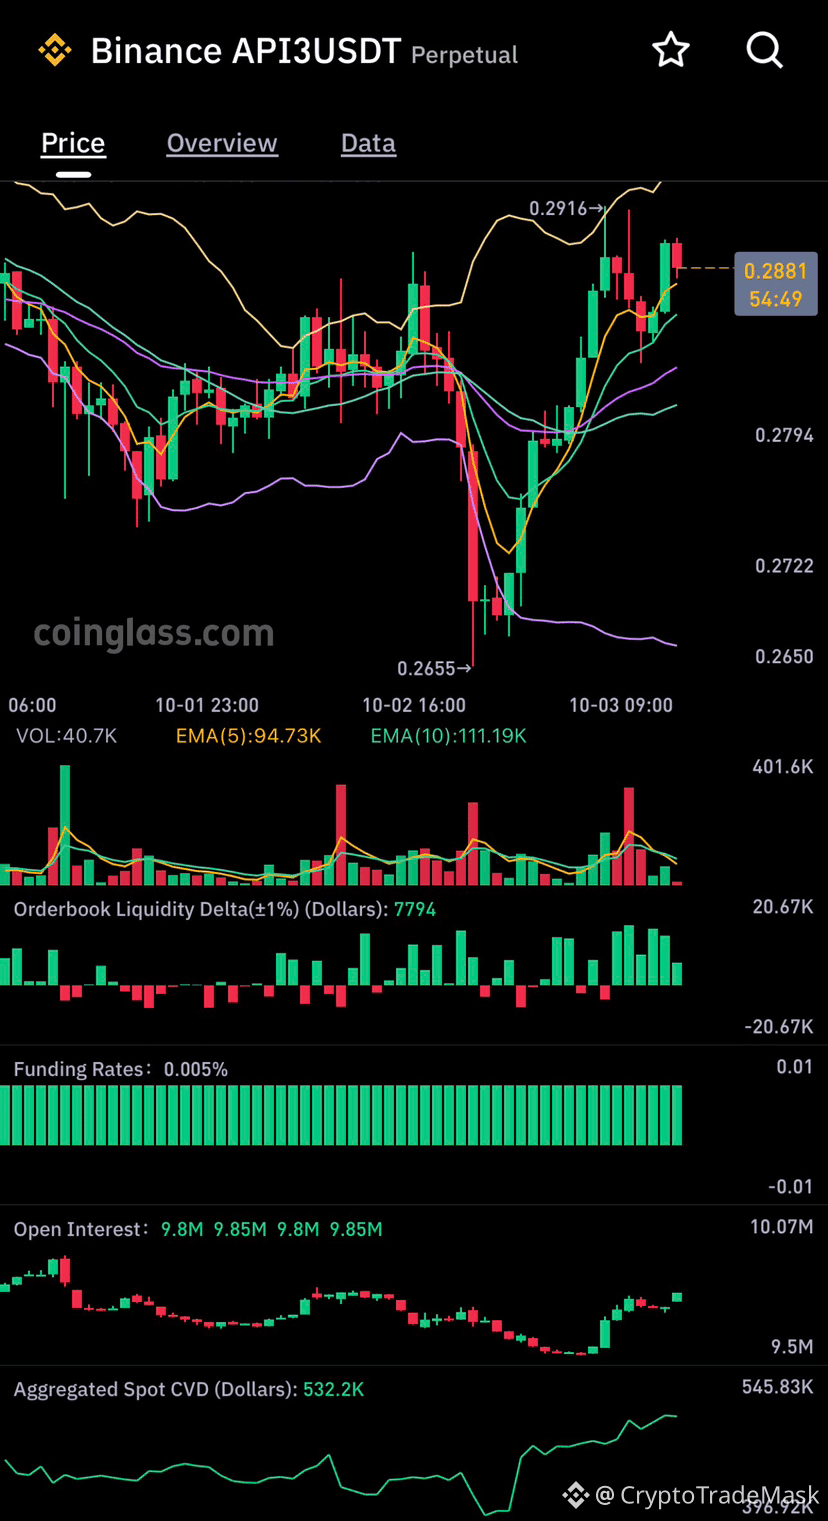
Technical status: The price is facing pressure from the upper Bollinger Band near $0.2916.
🔴 Trading plan (Short / Sell):
Entry: $0.2915 – $0.2960
Stop (SL): $0.3035 (above the $0.302 liquidity level)
Take-profits (TP): $0.2830 / $0.2770 / $0.2680
🎯 An alternative Long position is possible only after a deep pullback and a sweep of stops into the $0.277–$0.281 zone.
⚠️ Risks: Leverage up to 3x–5x; risk per trade no more than 1–2%.
The price is recovering after a drop to $0.2655 but is approaching a strong resistance zone at $0.292–$0.296, where seller liquidity pools are concentrated.
📊 Key observations:
Market sentiment: ~67% of retail accounts are Long. Such a high bias often acts as a trap and a counter-trend signal.
Whale activity: Over the last 60 minutes, large players have been primarily selling (net sell of $16K vs. $5.8K buy).
Technical status: The price is facing pressure from the upper Bollinger Band near $0.2916.
🔴 Trading plan (Short / Sell):
Entry: $0.2915 – $0.2960
Stop (SL): $0.3035 (above the $0.302 liquidity level)
Take-profits (TP): $0.2830 / $0.2770 / $0.2680
🎯 An alternative Long position is possible only after a deep pullback and a sweep of stops into the $0.277–$0.281 zone.
⚠️ Risks: Leverage up to 3x–5x; risk per trade no more than 1–2%.