🚨📉 $SAND — SHORT-TERM BEARISH SETUP
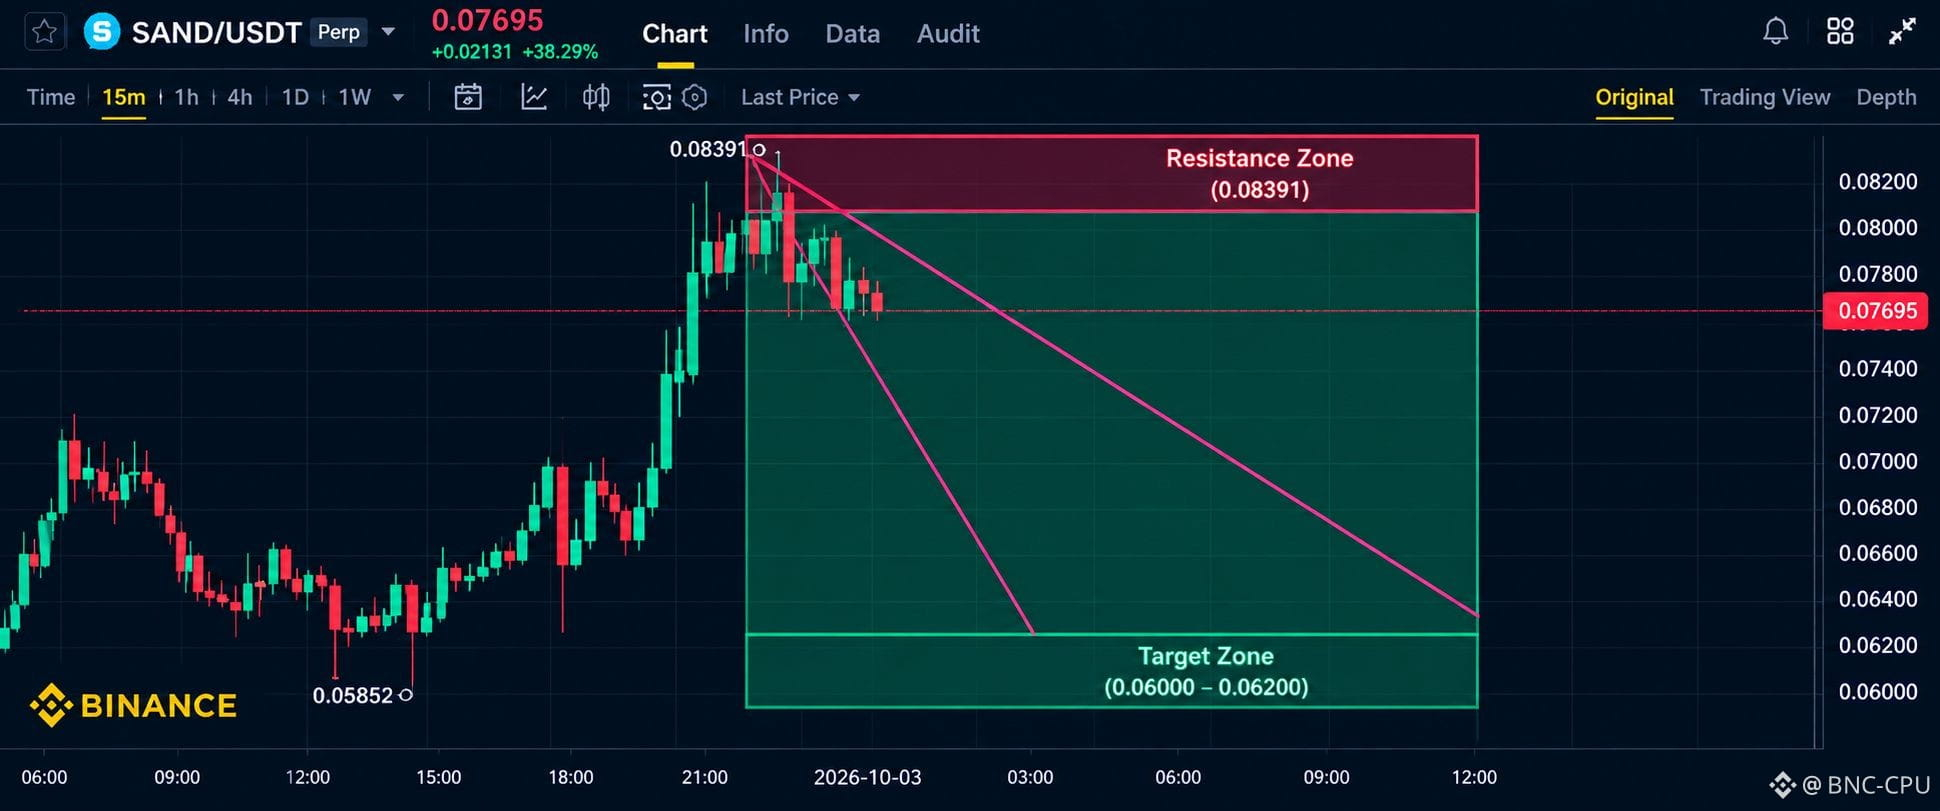
On the 15-minute SAND/USDT chart, price made a strong rally from around $0.05852 to a local high near $0.08391.
But after facing heavy resistance at the top, $SAND was sharply rejected and started pulling back.
📉 Current Structure: • Lower highs forming
• Lower lows developing
• Short-term selling pressure increasing
• Price remains below the key resistance zone
Key Resistance: $0.08391
Unless $SAND can reclaim and break above $0.08391 with strong confirmation, the short-term structure remains bearish, with sellers potentially maintaining control.
#downtrend #SANDUSTD
On the 15-minute SAND/USDT chart, price made a strong rally from around $0.05852 to a local high near $0.08391.
But after facing heavy resistance at the top, $SAND was sharply rejected and started pulling back.
📉 Current Structure: • Lower highs forming
• Lower lows developing
• Short-term selling pressure increasing
• Price remains below the key resistance zone
Key Resistance: $0.08391
Unless $SAND can reclaim and break above $0.08391 with strong confirmation, the short-term structure remains bearish, with sellers potentially maintaining control.
#downtrend #SANDUSTD