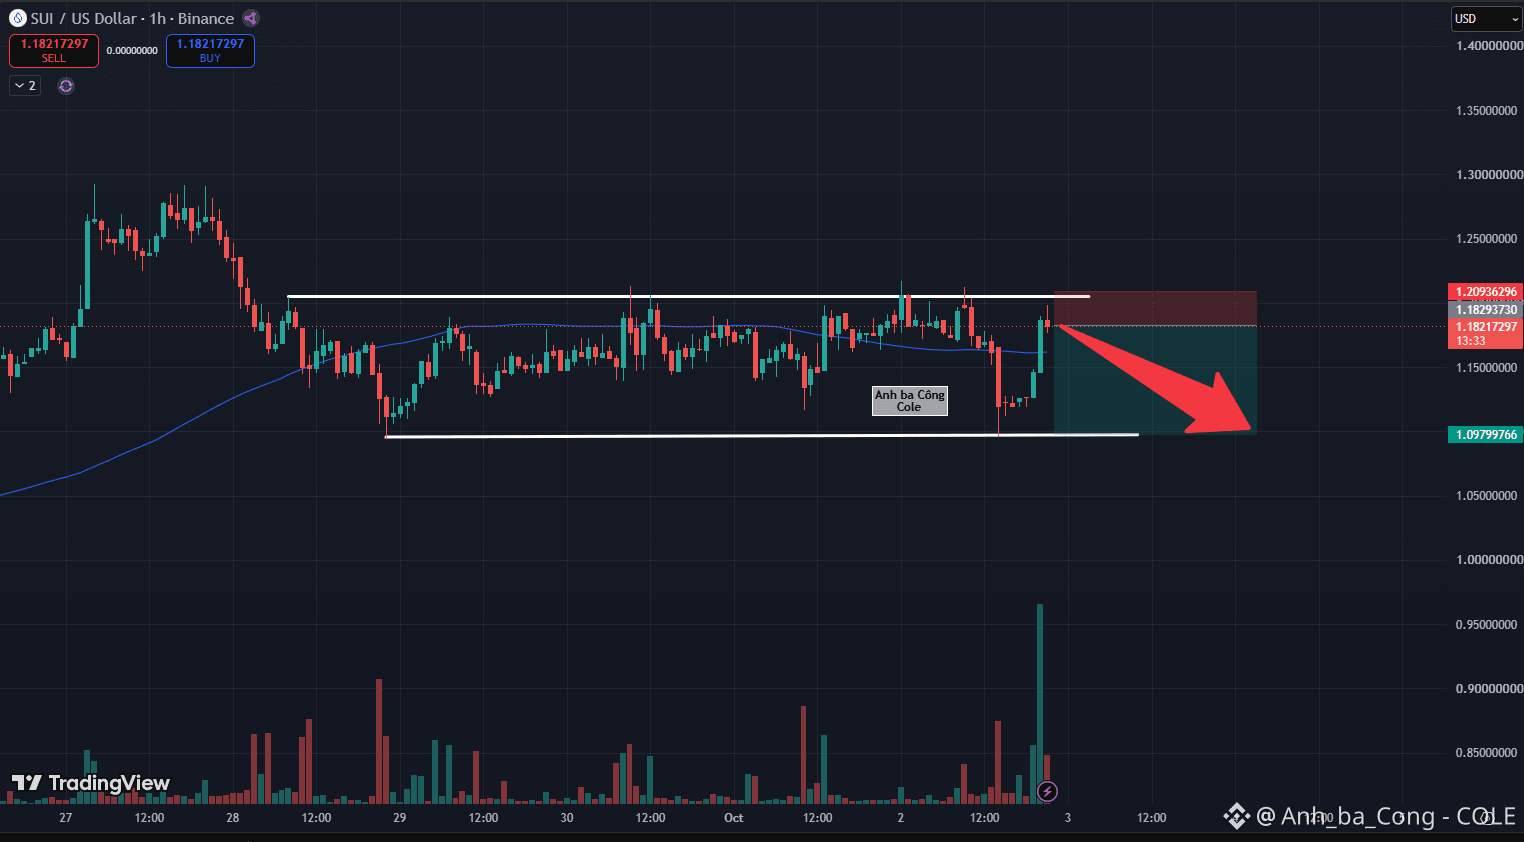
SUI: Massive Volume Spike Fails at Rectangle Ceiling – Strategic Range-Reversal Short Targeting $1.09 Floor
Sui (SUI) is presenting a textbook range-bound Short execution setup on the 1-hour timeframe as price action firmly respects the boundaries of a horizontal consolidation rectangle. Following days of sideways coiling around the flat dynamic MA100 baseline, recent buyer expansion met an aggressive wall of distribution directly at the upper structural ceiling.
Based on visual data from the 1-hour chart, the recent candle near the $1.182 handle printed a massive volume surge far exceeding preceding sessions. However, despite this exceptional influx of turnover, price action failed to engineer a clean close above the upper horizontal resistance line spanning $1.19–$1.20, leaving a visible upper rejection wick. Massive buying volume that fails to achieve upward progress confirms an absorption anomaly, where institutional sellers unload inventory directly into breakout demand. This rejection confirms that horizontal range dynamics remain fully in control, paving the way for prevailing sell-side momentum to drive a downward rotation.
The optimal trading approach is to initiate Short positions within the $1.182–$1.185 zone. A protective stop-loss parameter should be placed safely above the structural rectangle ceiling at $1.2093. The primary strategic take-profit objective targets the lower horizontal support floor near $1.0979, securing superior risk-to-reward metrics.
Disclaimer: This is not financial advice, DYOR. $SUI $SOL $ONE
Sui (SUI) is presenting a textbook range-bound Short execution setup on the 1-hour timeframe as price action firmly respects the boundaries of a horizontal consolidation rectangle. Following days of sideways coiling around the flat dynamic MA100 baseline, recent buyer expansion met an aggressive wall of distribution directly at the upper structural ceiling.
Based on visual data from the 1-hour chart, the recent candle near the $1.182 handle printed a massive volume surge far exceeding preceding sessions. However, despite this exceptional influx of turnover, price action failed to engineer a clean close above the upper horizontal resistance line spanning $1.19–$1.20, leaving a visible upper rejection wick. Massive buying volume that fails to achieve upward progress confirms an absorption anomaly, where institutional sellers unload inventory directly into breakout demand. This rejection confirms that horizontal range dynamics remain fully in control, paving the way for prevailing sell-side momentum to drive a downward rotation.
The optimal trading approach is to initiate Short positions within the $1.182–$1.185 zone. A protective stop-loss parameter should be placed safely above the structural rectangle ceiling at $1.2093. The primary strategic take-profit objective targets the lower horizontal support floor near $1.0979, securing superior risk-to-reward metrics.
Disclaimer: This is not financial advice, DYOR. $SUI $SOL $ONE