🟢 $BNB /USDT — LONG SETUP 📈
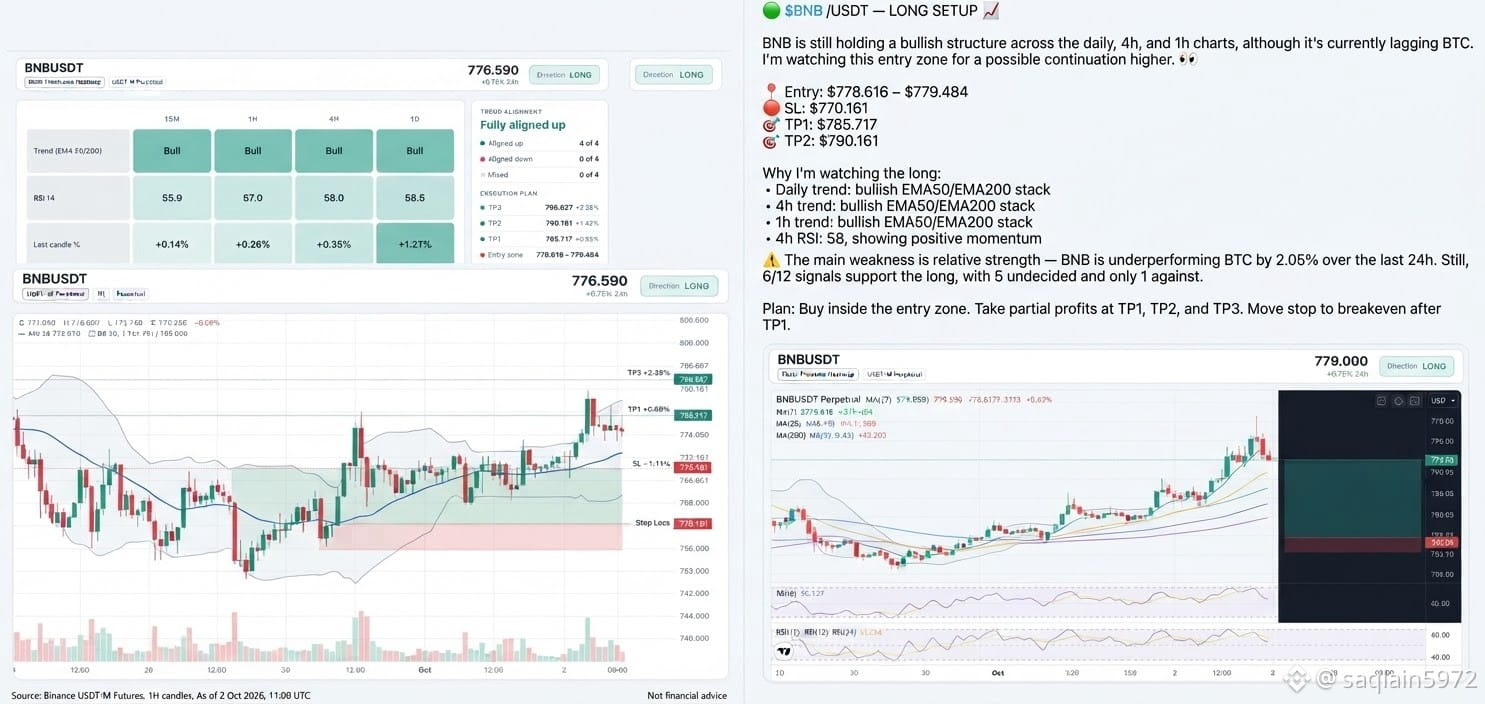
BNB is still holding a bullish structure across the daily, 4h, and 1h charts, although it’s currently lagging BTC. I’m watching this entry zone for a possible continuation higher. 👀
📍 Entry: $778.616 – $779.484
🛑 SL: $770.161
🎯 TP1: $785.717
🎯 TP2: $790.161
🎯 TP3: $796.827
Why I’m watching the long:
• Daily trend: bullish EMA50/EMA200 stack
• 4h trend: bullish EMA50/EMA200 stack
• 1h trend: bullish EMA50/EMA200 stack
• 4h RSI: 58, showing positive momentum
⚠️ The main weakness is relative strength — BNB is underperforming BTC by 2.05% over the last 24h. Still, 6/12 signals support the long, with 5 undecided and only 1 against.
Plan: wait for the entry zone instead of chasing. Take partial profit at TP1, then move the stop toward breakeven if the move continues.
A break below $770.161 would invalidate the bullish setup.
💬 Where would you place your BNB long invalidation?
Levels mapped below 👇
BNB is still holding a bullish structure across the daily, 4h, and 1h charts, although it’s currently lagging BTC. I’m watching this entry zone for a possible continuation higher. 👀
📍 Entry: $778.616 – $779.484
🛑 SL: $770.161
🎯 TP1: $785.717
🎯 TP2: $790.161
🎯 TP3: $796.827
Why I’m watching the long:
• Daily trend: bullish EMA50/EMA200 stack
• 4h trend: bullish EMA50/EMA200 stack
• 1h trend: bullish EMA50/EMA200 stack
• 4h RSI: 58, showing positive momentum
⚠️ The main weakness is relative strength — BNB is underperforming BTC by 2.05% over the last 24h. Still, 6/12 signals support the long, with 5 undecided and only 1 against.
Plan: wait for the entry zone instead of chasing. Take partial profit at TP1, then move the stop toward breakeven if the move continues.
A break below $770.161 would invalidate the bullish setup.
💬 Where would you place your BNB long invalidation?
Levels mapped below 👇