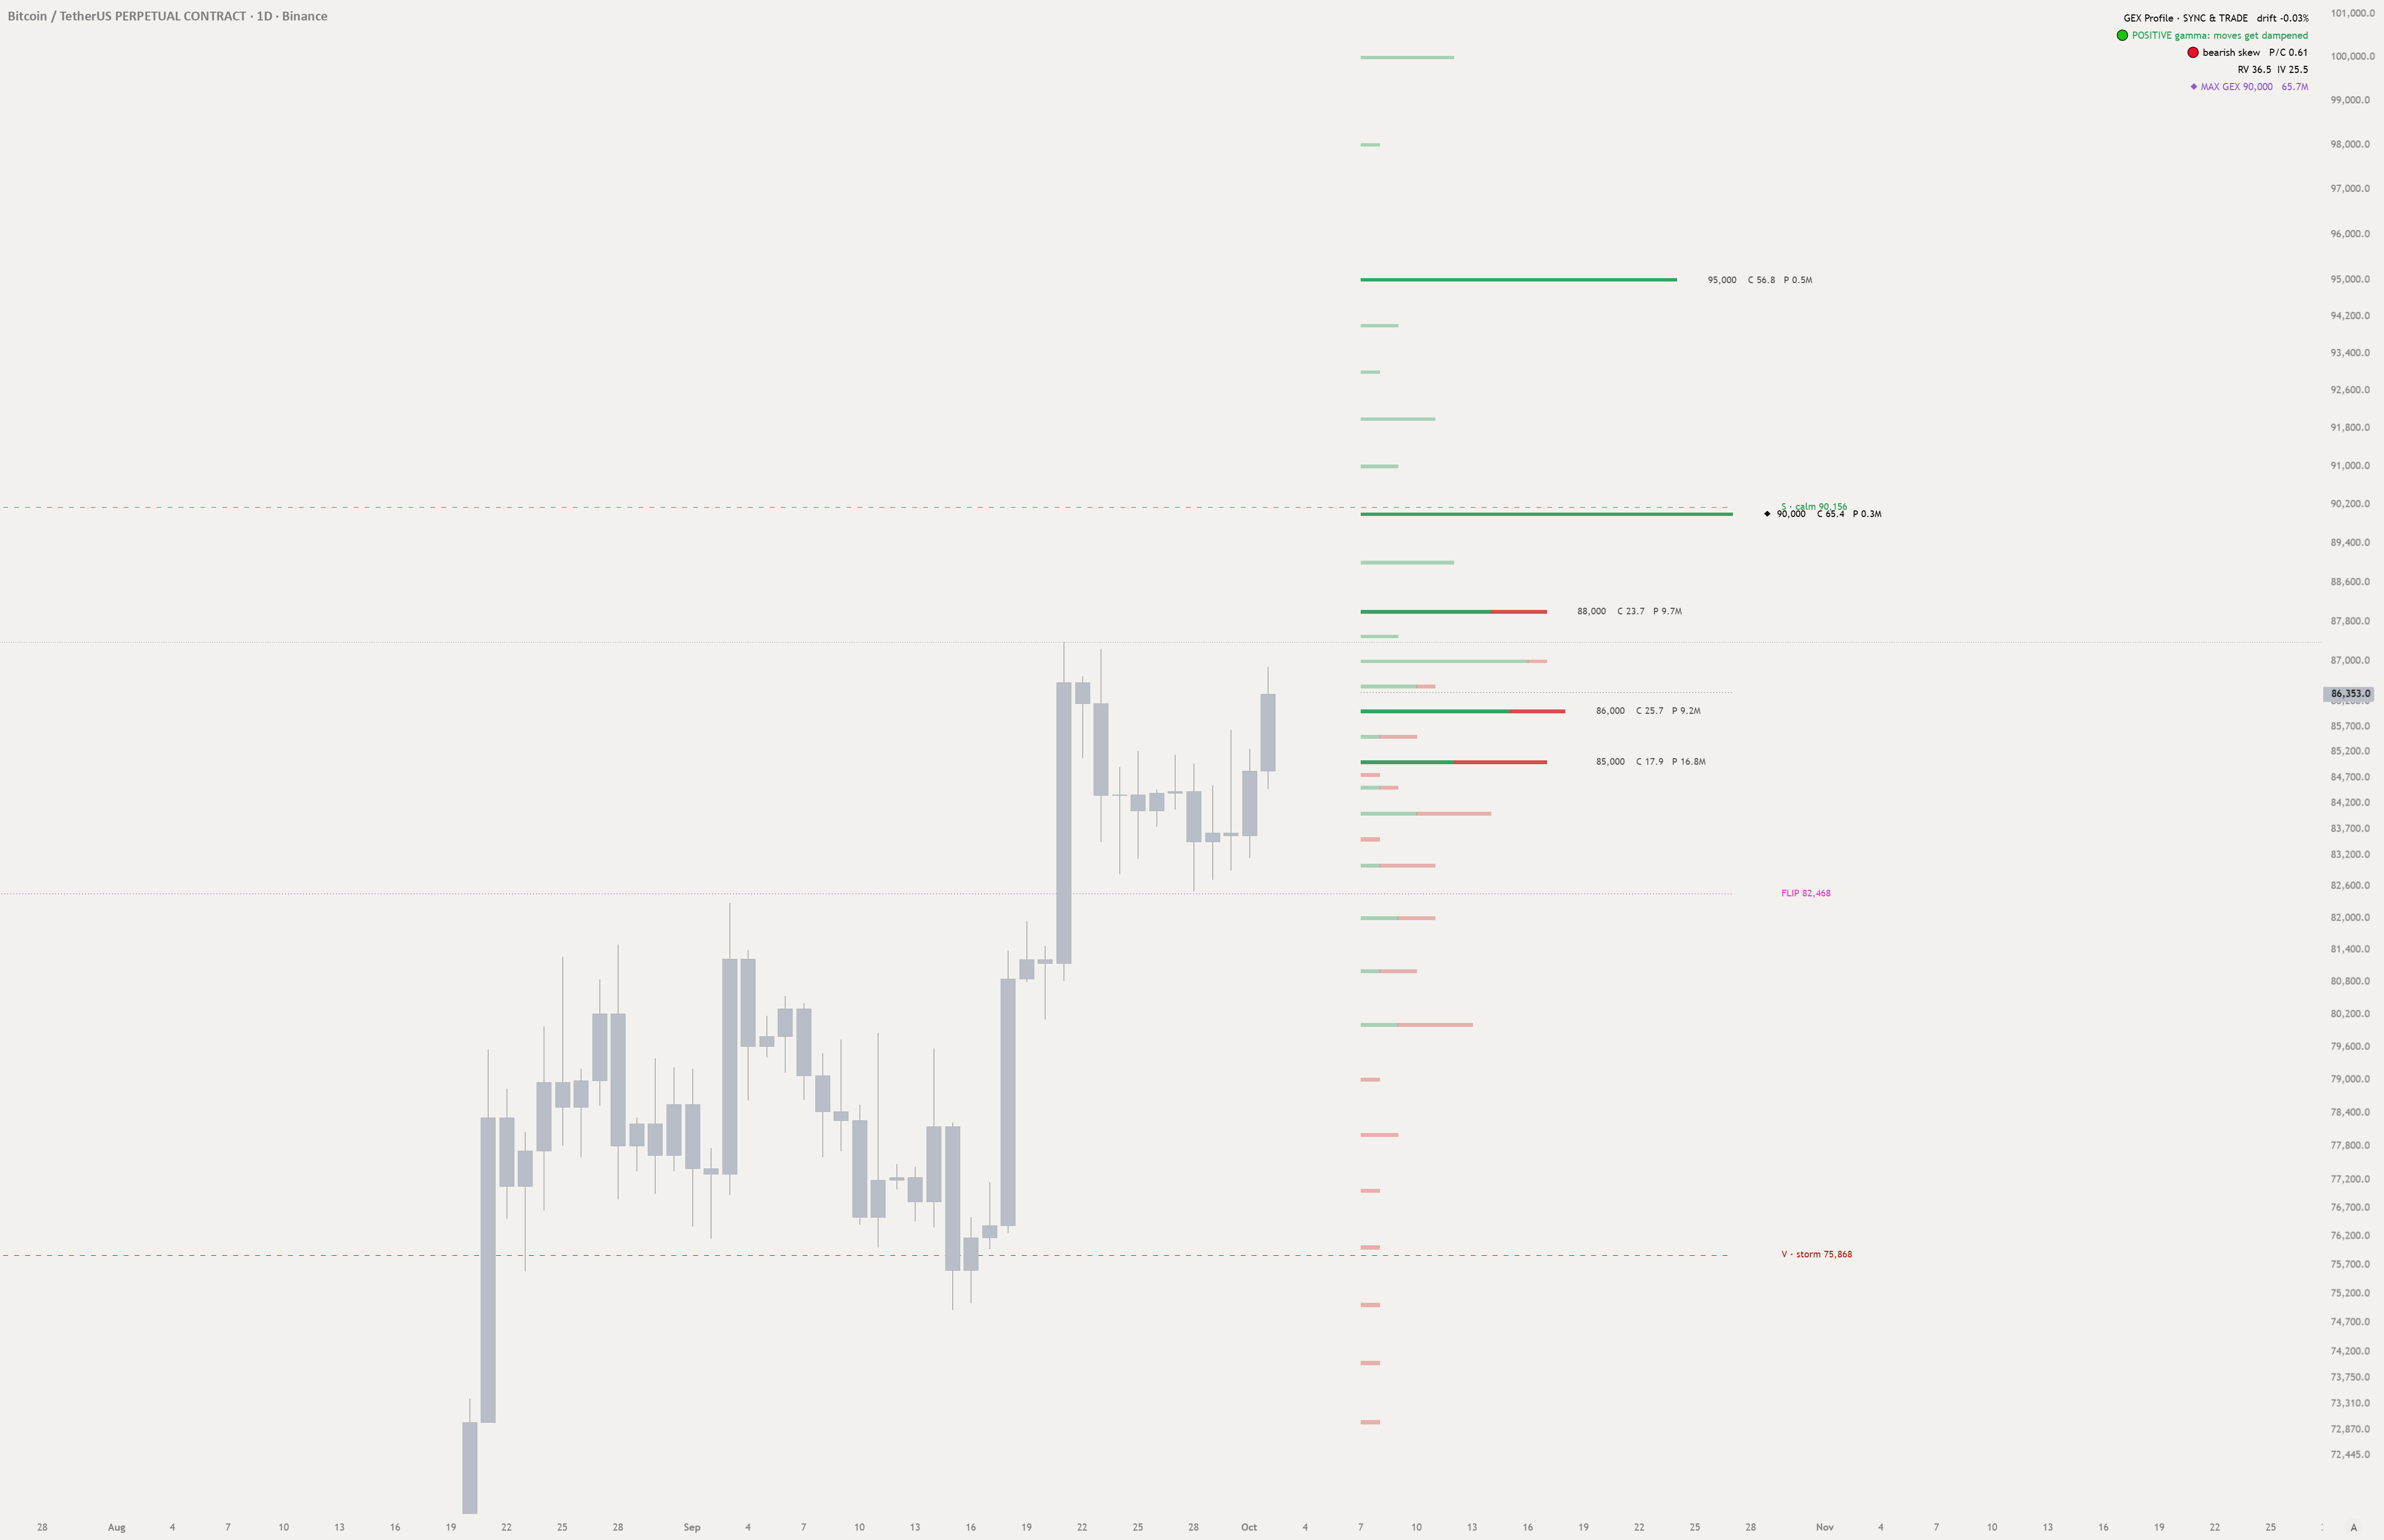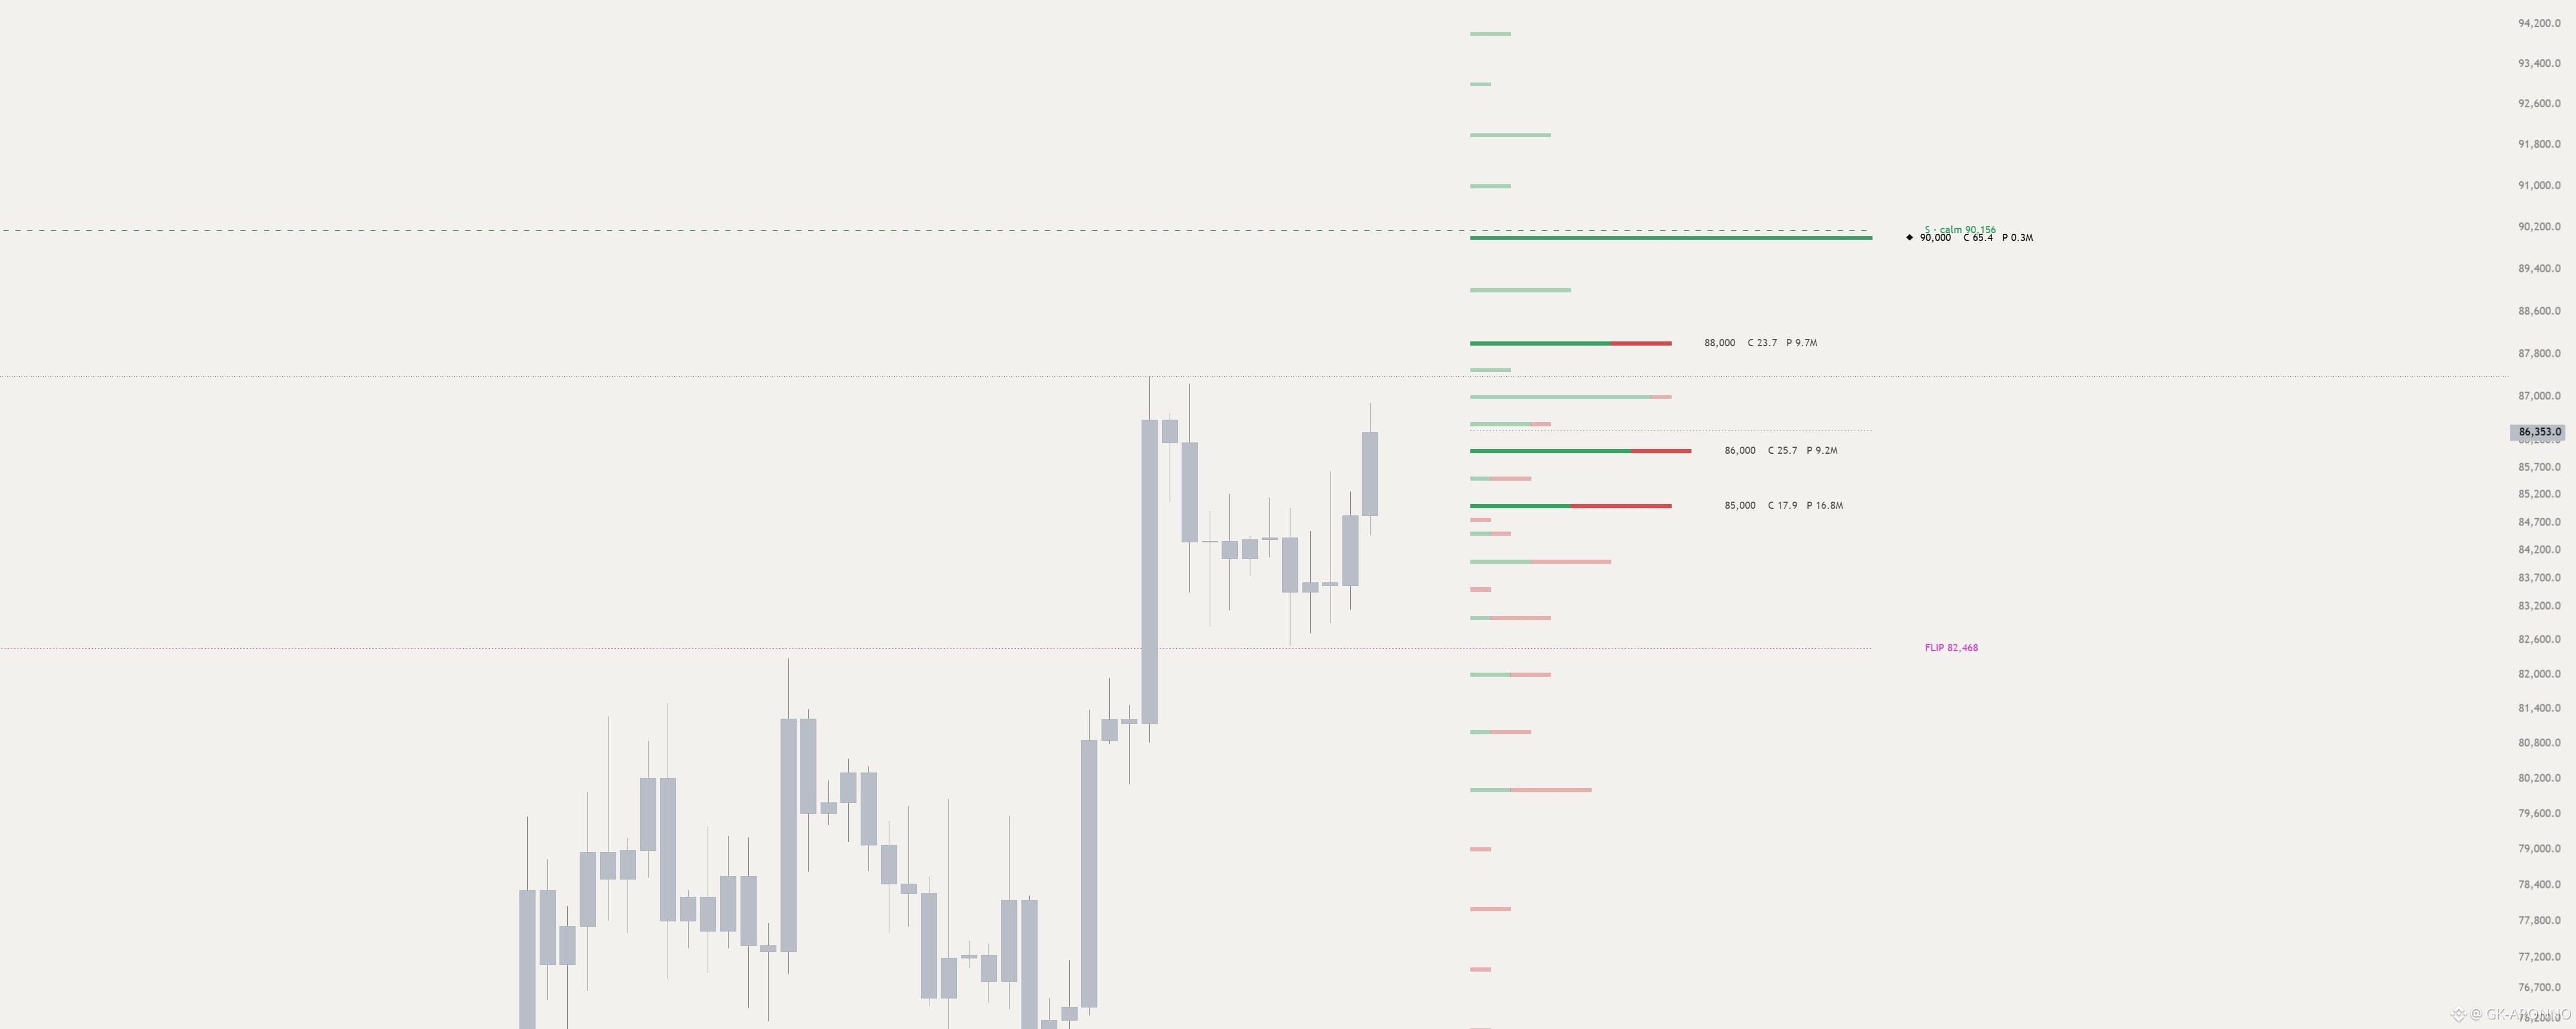


At 04:00 UTC today BTC printed an hourly volume spike — 6× the weekly median — and ran from 85,450 to 86,900. Then, for the four hours into the 08:00 UTC expiry, price sat almost exactly on 86,000 — the largest strike of the expiring series.
Day and week (expiries Oct 3 and Oct 4, 08:00 UTC) • Gamma flip: 85,990 (day) / 85,770 (week). Price is just above it: dealers are long gamma and dampen moves, but the cushion is thin. • Call wall 87,000, put support 85,000, magnet 86,000. • Below ~85,800 the regime turns: dealers hedge by selling into drops.
Month (expiry Oct 30) • Call wall and magnet at 90,000, then 95,000 — the largest nodes in the whole BTC options market. • Put support 85,000; the monthly flip is far below at 82,400.
Across all expiries the market is in a "calm" regime: the flip sits at 78,400 and large moves tend to get absorbed.
On volume spikes. We tested the history. In BTC, an hourly volume spike of 5× the weekly median happens about twice a week, most often around 13:00–15:00 UTC (US open and data releases). After a spike, a strong move within the next 4 hours (two typical 4-hour moves or more) happens about 3× as often as usual — in BTC, ETH and SOL alike, across all years tested. The direction, however, is a coin flip: continuation and reversal are equally common. A spike tells you a move is likely — not which way.
Nobody knows where price goes next. What you can see is where moves get braked and where they get pushed.
Data: Deribit, Bybit, OKX and Binance options, combined; spot candles and volume from Binance. Levels snapshot Oct 2, 2026, 10:16 UTC. Volume-spike statistics: BTC hourly candles over 2 years; the "3× as often" result is pooled over BTC, ETH and SOL hourly data since 2017, checked separately on 2017–2022, 2023–2024 and 2025–2026