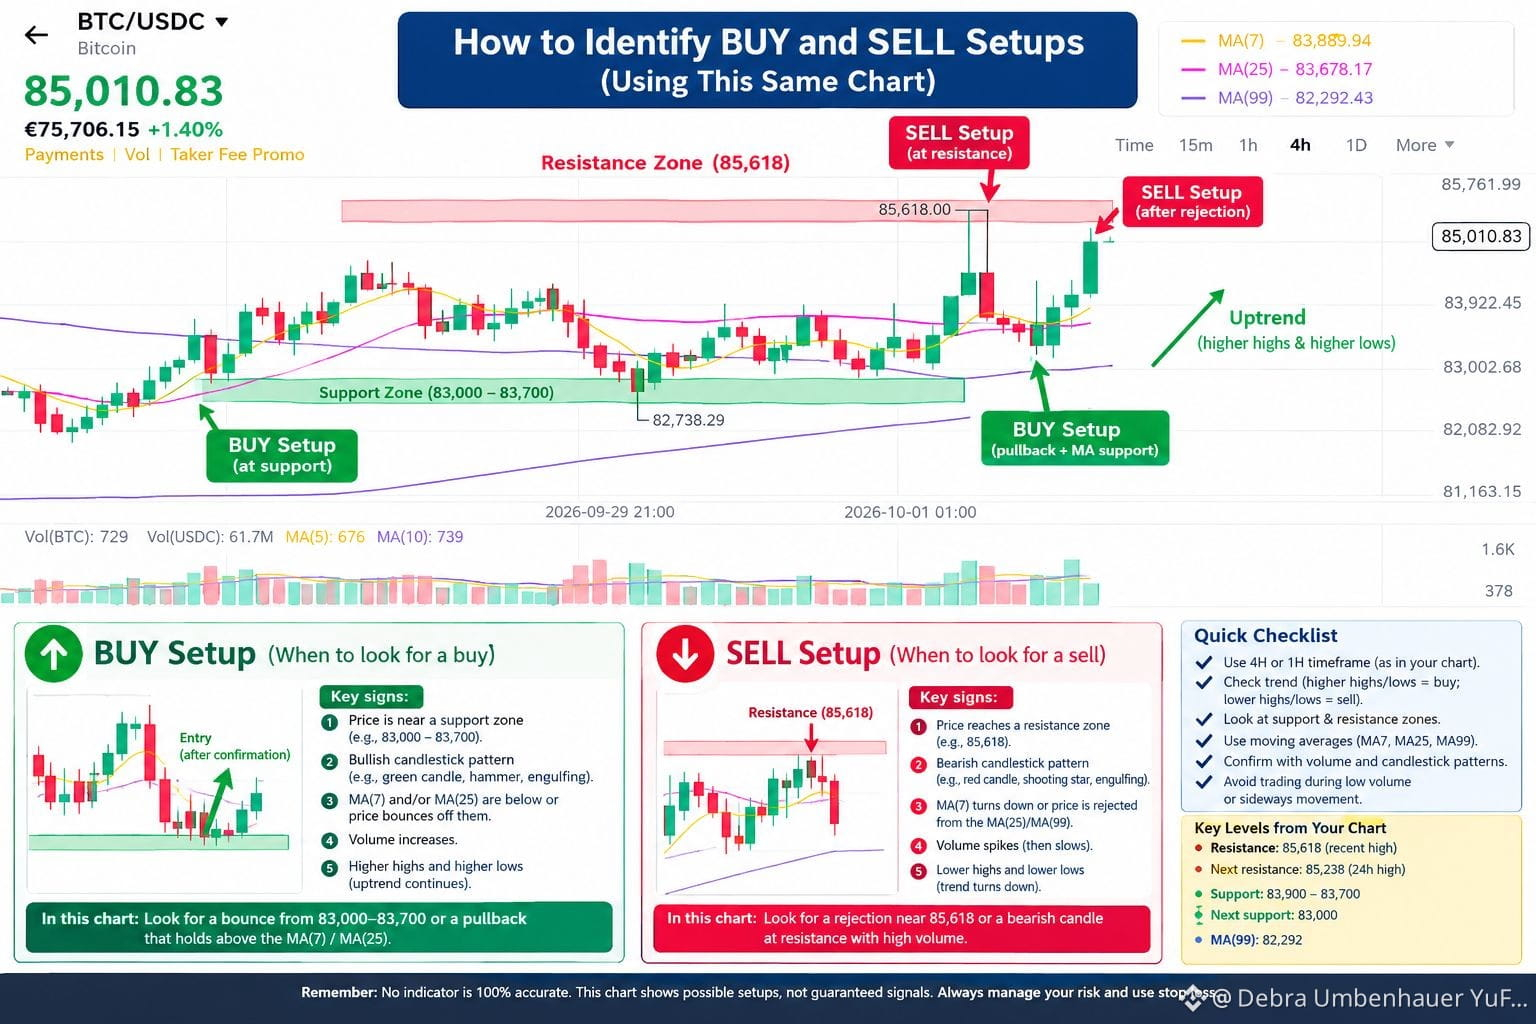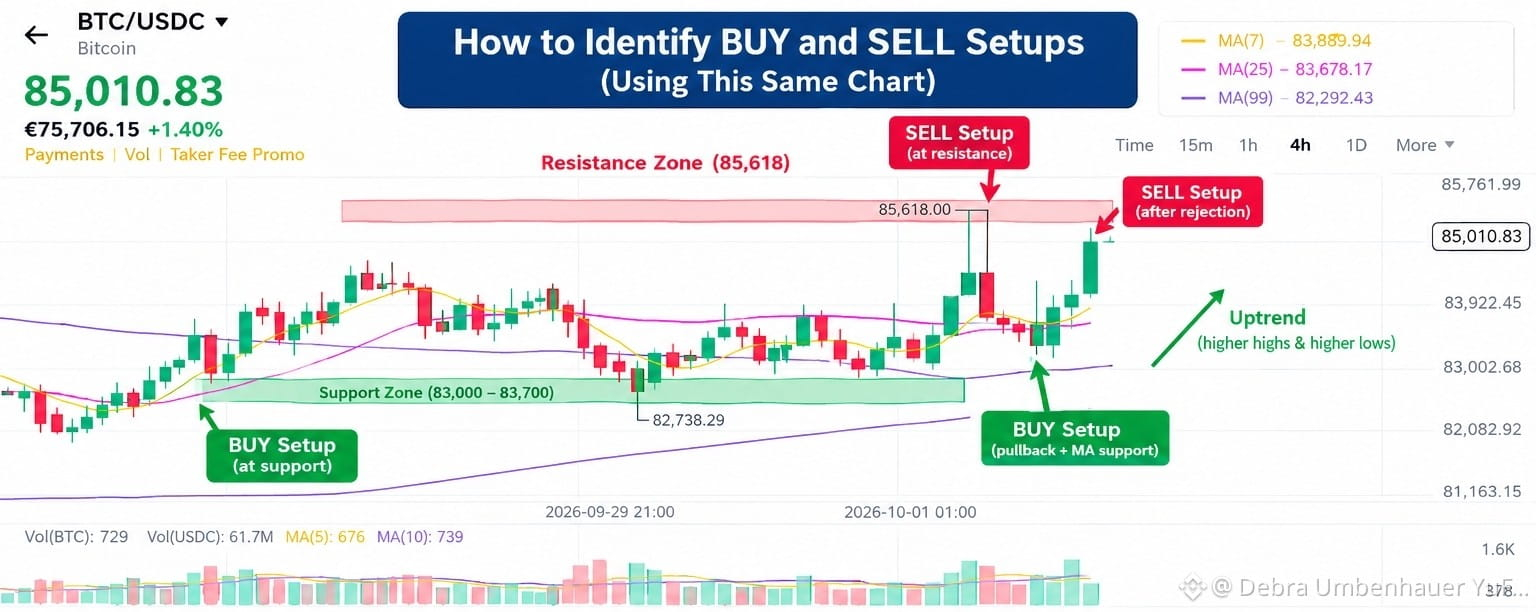
$BTC The picture shows a BTC/USDC 4-hour chart with moving averages, support, resistance, candlesticks, and volume. The goal is not to predict the market with certainty, but to wait for several signals to line up before considering a trade.
🟢 1. How to identify a BUY setup
A potential BUY setup generally becomes more interesting when price comes down toward a support zone and then shows signs of bouncing.
In the picture, the main support area is approximately 83,000–83,700.
Look for these signals:
Price reaches support
BTC falls toward the support zone instead of buying after a large upward candle.
Price rejects the support
You may see a candle with a lower wick followed by a bullish candle. This suggests buyers are stepping in.
Moving averages provide support
In the screenshot:
MA(7) ≈ 83,890
MA(25) ≈ 83,678
MA(99) ≈ 82,292
Price staying above the shorter moving averages can support the idea that the short-term trend remains upward.
Volume confirms the move
A bounce accompanied by stronger volume is generally more meaningful than a bounce occurring on very low volume.
Higher highs and higher lows
This is one of the simplest ways to recognize an uptrend.
Example from the picture
Support → bounce → bullish candle → volume confirmation → possible BUY setup.
Don't automatically buy simply because price touches support. Wait for confirmation.
🔴 2. How to identify a SELL setup
A potential SELL setup can occur when price reaches a resistance zone and starts getting rejected.
In this picture, an important resistance is around 85,618, with the recent 24-hour high around 85,238.
Look for:
Price reaches resistance
Price fails to break through
A bearish candle or rejection wick appears.
Volume increases during the rejection.
The chart begins making lower highs and lower lows.
For example:
Resistance → rejection → bearish candle → confirmation → possible SELL setup.
Again, touching resistance alone isn't enough. Price can break through resistance instead.
📈 3. What the moving averages are telling you
The picture has three moving averages:
Indicator
Approx. value
MA(7)
83,890
MA(25)
83,678
MA(99)
82,292
Think of them as trend guides, not automatic BUY/SELL signals.
When price is above the moving averages and they are generally rising, the market structure is stronger.
When price falls below them and they begin turning downward, the trend is becoming weaker.
🟡 4. Support vs. resistance
Support
A price area where buyers have previously appeared.
In your chart:
83,000–83,700 is an important support area.
Resistance
A price area where sellers have previously appeared.
In your chart:
85,238–85,618 is an important area to watch.
The key idea is:
Buy setups are usually searched for near support after confirmation. Sell setups are usually searched for near resistance after confirmation.
📊 5. Why volume matters
The bars underneath the candles show volume.
Imagine BTC moves from 84,000 to 85,000.
If the move happens with strong volume, it provides more evidence that there was significant participation.
If the price moves upward but volume is very weak, you should be more cautious.
Volume is therefore best used as confirmation, rather than as a standalone signal.
🧠 6. The simple strategy to remember
🟢 BUY checklist
Support → rejection/bounce → bullish candle → volume → trend confirmation
🔴 SELL checklist
Resistance → rejection → bearish candle → volume → trend weakening
Don't trade simply because one candle is green or red.
⚠️ One very important lesson
The chart in your picture is 4H, meaning each candle represents four hours.
A candle can look bullish while it is still forming and then close differently. For that reason, beginners often wait for the candle to close before treating it as confirmation.
Also, no chart pattern guarantees a profit. A sensible trade plan should include a stop-loss so that one incorrect trade doesn't cause a large loss.
For your specific screenshot, the basic map is:
82,292 → 83,000–83,700 support → 85,238 recent high → 85,618 resistance
Those are the areas I would learn to watch first—not because they guarantee what BTC will do next, but because they give you a structured way to read the chart.