$BNB 1. Current Market Context & Price Action Structure
The crypto market is currently moving through a macro-driven consolidation phase. While Bitcoin fluctuates near the $83,000 – $84,000 range—weighed down by rising U.S. Treasury yields and macroeconomic crosscurrents—major altcoins like BNB are exhibiting typical range-bound behavior following recent profit-taking cycles.
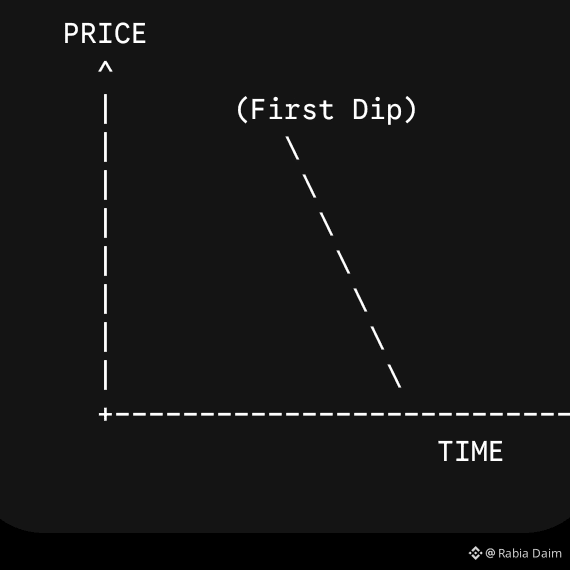
Visualizing the BNB Chart (Technical Mapping):
The Range: BNB is trading inside a localized horizontal accumulation channel.
Moving Averages: On daily timeframes, BNB remains tethered close to its mid-range moving averages, reflecting balanced buyer and seller momentum without an aggressive breakout either way.
Volume Profile: Trading volumes have normalized after September's volatility spikes, indicating that the market is waiting for a broader macro catalyst (such as upcoming U.S. employment data or shifts in Federal Reserve policy).
2. Key Technical Levels to Watch
If you are looking at your charts right now, mark these critical zones:
Immediate Support Zone: BNB's immediate safety net lies in its local lower-bound support. If minor corrections expand, look for buyers to step in heavily here to defend the trend.
Immediate Resistance Zone: On the upside, BNB faces resistance where previous breakout attempts stalled. A confirmed daily candle close above this overhead resistance is required to ignite fresh bullish momentum.
Macro Pivot: As always, BNB maintains a strong psychological correlation with Bitcoin's ability to hold its vital $82,000–$83,000 support area.
#BNB走势
The crypto market is currently moving through a macro-driven consolidation phase. While Bitcoin fluctuates near the $83,000 – $84,000 range—weighed down by rising U.S. Treasury yields and macroeconomic crosscurrents—major altcoins like BNB are exhibiting typical range-bound behavior following recent profit-taking cycles.
Visualizing the BNB Chart (Technical Mapping):
The Range: BNB is trading inside a localized horizontal accumulation channel.
Moving Averages: On daily timeframes, BNB remains tethered close to its mid-range moving averages, reflecting balanced buyer and seller momentum without an aggressive breakout either way.
Volume Profile: Trading volumes have normalized after September's volatility spikes, indicating that the market is waiting for a broader macro catalyst (such as upcoming U.S. employment data or shifts in Federal Reserve policy).
2. Key Technical Levels to Watch
If you are looking at your charts right now, mark these critical zones:
Immediate Support Zone: BNB's immediate safety net lies in its local lower-bound support. If minor corrections expand, look for buyers to step in heavily here to defend the trend.
Immediate Resistance Zone: On the upside, BNB faces resistance where previous breakout attempts stalled. A confirmed daily candle close above this overhead resistance is required to ignite fresh bullish momentum.
Macro Pivot: As always, BNB maintains a strong psychological correlation with Bitcoin's ability to hold its vital $82,000–$83,000 support area.
#BNB走势