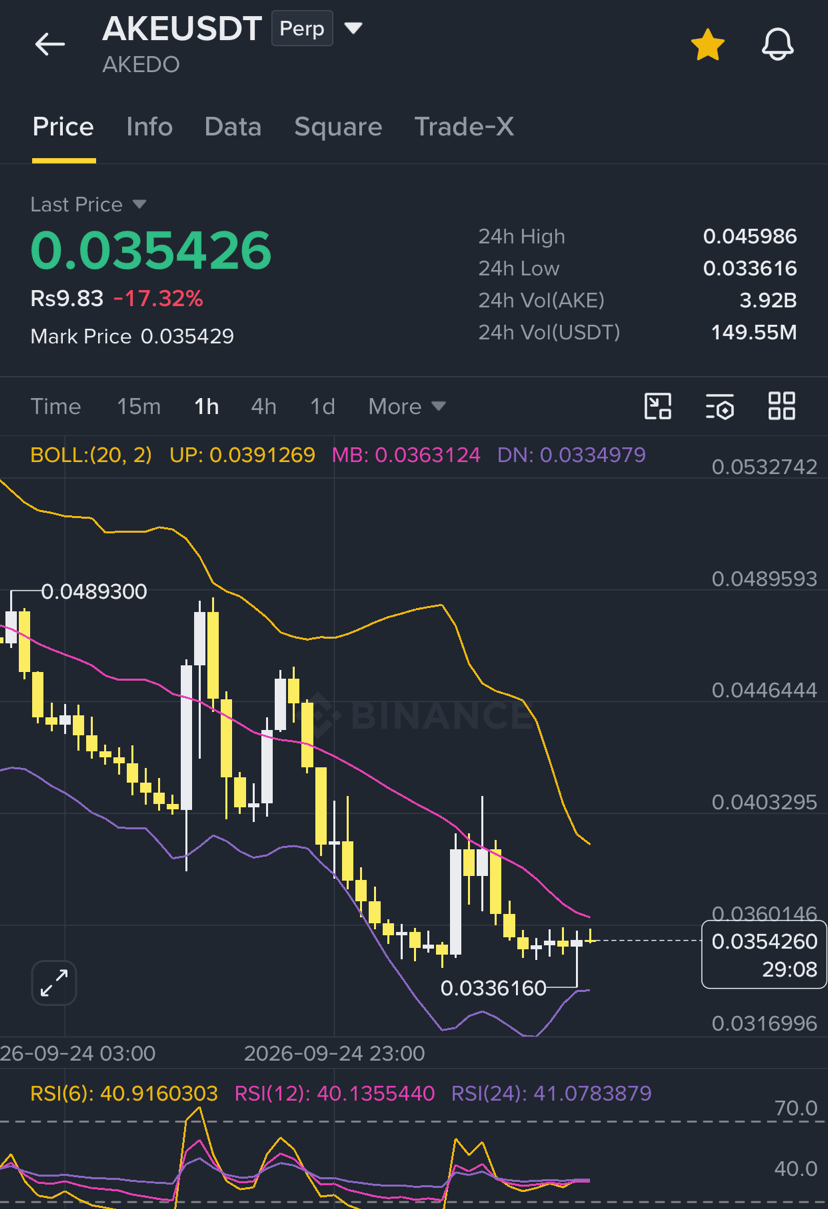
When analyzing $AKE /USDT (AKEDO) around the $0.035 level, the price sits near a critical inflection point where major horizontal support aligns with previous consolidation zones.
Technical Structure & Key Levels
1. Key Levels of Interest
Immediate Support: $0.0330 – $0.0350
This acts as the primary demand zone. A daily close remaining above $0.0350 indicates buyers are defending the local low.
Key Resistance: $0.0400 – $0.0420
Breakout level needed to flip market structure from neutral/bearish to bullish.
Secondary Resistance (Upside Target): $0.0480 – $0.0520
Previous liquidity cluster and local high region.
Invalidation / Breakdown Level: Below $0.0320
A sustained daily breakdown below $0.0320 invalidates the consolidation setup and risks acceleration toward lower liquidity ($0.0280).
Technical Indicators Breakdown
Relative Strength Index (RSI): Near oversold/neutral territory (~35–45 range on daily charts). This suggests selling momentum is slowing down, raising the probability of a relief bounce.
Moving Averages (EMA 20/50): The $0.0380 – $0.0400 range serves as dynamic resistance where short-term exponential moving averages converge.
Volume Profile: A decrease in selling volume near $0.0350 hints at seller exhaustion, but confirmation requires a surge in buying volume to push past $0.0400.
Tactical Scenarios & Trade Plans
Scenario A: Bullish Bounce (Accumulation at Support)
Trigger: Price holds above $0.0350 and forms a bullish reversal pattern (e.g., bullish engulfing or double bottom on 1H/4H timeframe).
Upside Targets:
Target 1: $0.0400 (Partial profit-taking)
Target 2: $0.0480
Invalidation Stop-Loss: Daily close below $0.0320.
Scenario B: Bearish Breakdown
Trigger: Loss of $0.0350 support accompanied by high selling volume.
Downside Targets: Next demand zone around $0.0280 – $0.0300.
Disclaimer: Crypto assets and low-cap altcoins carry high volatility and execution risks. Always use strict position sizing and risk management.
Technical Structure & Key Levels
1. Key Levels of Interest
Immediate Support: $0.0330 – $0.0350
This acts as the primary demand zone. A daily close remaining above $0.0350 indicates buyers are defending the local low.
Key Resistance: $0.0400 – $0.0420
Breakout level needed to flip market structure from neutral/bearish to bullish.
Secondary Resistance (Upside Target): $0.0480 – $0.0520
Previous liquidity cluster and local high region.
Invalidation / Breakdown Level: Below $0.0320
A sustained daily breakdown below $0.0320 invalidates the consolidation setup and risks acceleration toward lower liquidity ($0.0280).
Technical Indicators Breakdown
Relative Strength Index (RSI): Near oversold/neutral territory (~35–45 range on daily charts). This suggests selling momentum is slowing down, raising the probability of a relief bounce.
Moving Averages (EMA 20/50): The $0.0380 – $0.0400 range serves as dynamic resistance where short-term exponential moving averages converge.
Volume Profile: A decrease in selling volume near $0.0350 hints at seller exhaustion, but confirmation requires a surge in buying volume to push past $0.0400.
Tactical Scenarios & Trade Plans
Scenario A: Bullish Bounce (Accumulation at Support)
Trigger: Price holds above $0.0350 and forms a bullish reversal pattern (e.g., bullish engulfing or double bottom on 1H/4H timeframe).
Upside Targets:
Target 1: $0.0400 (Partial profit-taking)
Target 2: $0.0480
Invalidation Stop-Loss: Daily close below $0.0320.
Scenario B: Bearish Breakdown
Trigger: Loss of $0.0350 support accompanied by high selling volume.
Downside Targets: Next demand zone around $0.0280 – $0.0300.
Disclaimer: Crypto assets and low-cap altcoins carry high volatility and execution risks. Always use strict position sizing and risk management.