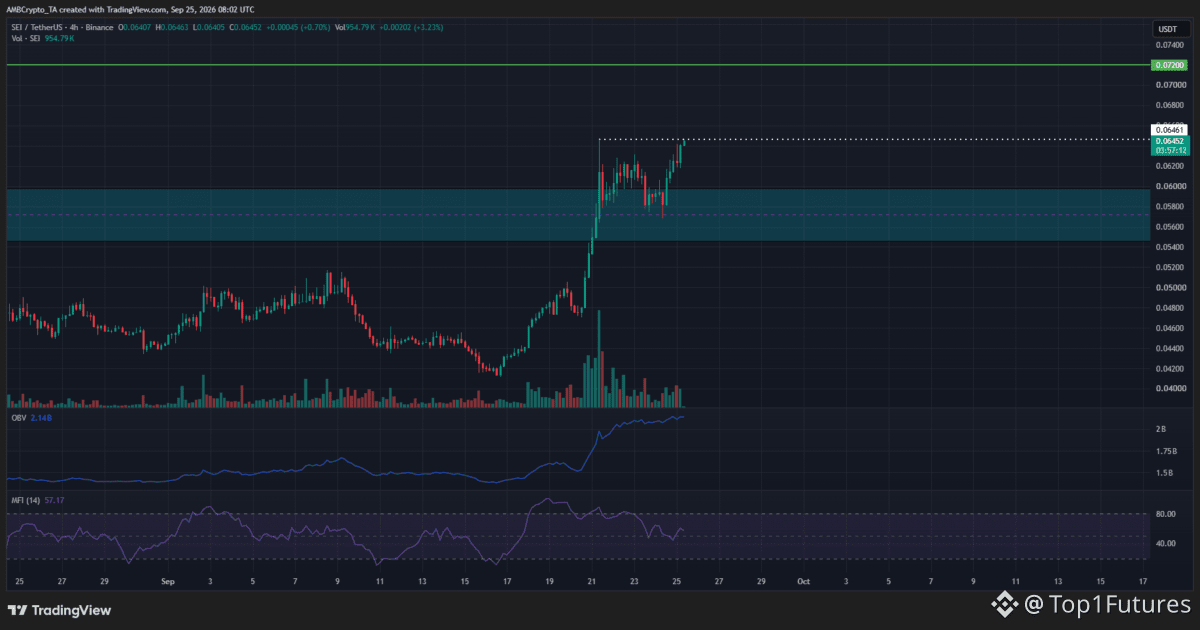
$SEI 📉 has completely changed its short-term structure after reclaiming the $0.055–$0.060 supply zone and flipping it into support.
Buyers have also taken out the previous lower high near $0.060, giving the daily chart a clear bullish structure.
Now price is pressing against the $0.0646 local high. A strong 4H close above that level could open the door toward $0.072, while the $0.0568 low becomes the key level bulls need to defend to keep the current uptrend intact.
The bigger picture is where things get interesting.
SEI’s weekly trend is still bearish, so this rally hasn’t confirmed a long-term reversal yet. A weekly close above $0.080 would be a much stronger signal that the broader trend is starting to shift.
With OBV reaching levels not seen since January and volume picking up, demand is clearly improving—but the MFI is already overbought, so chasing the move carries more risk than waiting for confirmation or a controlled retest.
$0.055–$0.060 → support zone
$0.0646 → immediate breakout trigger
$0.072 → next upside target
$0.080 → higher-timeframe trend-shift level
The real question now: Can SEI turn $0.0646 into the next support instead of another rejection point?
#sei
Buyers have also taken out the previous lower high near $0.060, giving the daily chart a clear bullish structure.
Now price is pressing against the $0.0646 local high. A strong 4H close above that level could open the door toward $0.072, while the $0.0568 low becomes the key level bulls need to defend to keep the current uptrend intact.
The bigger picture is where things get interesting.
SEI’s weekly trend is still bearish, so this rally hasn’t confirmed a long-term reversal yet. A weekly close above $0.080 would be a much stronger signal that the broader trend is starting to shift.
With OBV reaching levels not seen since January and volume picking up, demand is clearly improving—but the MFI is already overbought, so chasing the move carries more risk than waiting for confirmation or a controlled retest.
$0.055–$0.060 → support zone
$0.0646 → immediate breakout trigger
$0.072 → next upside target
$0.080 → higher-timeframe trend-shift level
The real question now: Can SEI turn $0.0646 into the next support instead of another rejection point?
#sei