

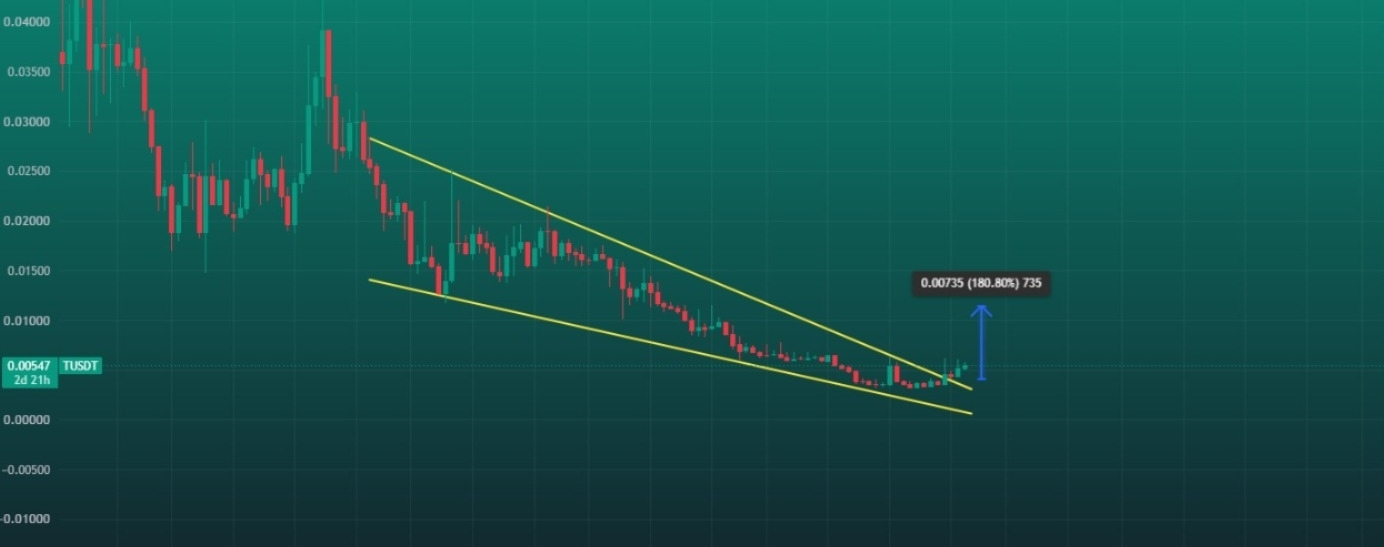

$T (Threshold) has officially broken out of a multi year Falling Wedge pattern on the 1W timeframe! Price action has cleared the upper resistance trendline, signaling a major macro trend reversal for the coin.
When multi-month macro wedges break to the upside, the following expansion waves are usually swift and explosive! 🎯
💵 Coin: T (Threshold) / USDT
⌛ Time Frame: 1W (Weekly)
📉 Pattern: Falling Wedge (Macro Multi-Month Structure)
🏦 Exchange: Binance
📍 Current Price: around 0.00547
📉 Pattern: Falling Wedge (Macro Multi-Month Structure)
🎯 Current Area: around 0.00547
📉 Immediate Resistance / Breakout Zone: 0.00550 – 0.00600
🎯 Key Resistance: 0.00750 → 0.01000 → 0.01282 (Target) → 0.01800 → 0.02500
🛡️ Key Support: 0.00500 → 0.00450 → 0.00350
📐 Technical Structure
🔻 Upper Descending Resistance Line
Formed from a continuous series of lower highs starting from mid-2025 (~0.02800). This line has acted as macro dynamic overhead resistance for over a year.
🔺 Lower Descending Support Line
Formed by converging lower lows where long-term buyers have consistently absorbed selling pressure, defining the bottom boundary of the Falling Wedge.
🔄 Falling Wedge Compression
Price action has gradually narrowed and compressed toward the apex of the wedge. Falling wedges are historically bullish reversal patterns, indicating seller exhaustion.
⚡ Weekly Breakout Attempt
Price is currently breaking above the upper trendline near 0.00547. The chart shows a measured price prediction tool pointing toward 0.01282 (+180.80% upside potential).
🟢 Bullish Scenario
🚀 A valid weekly candle close above 0.00580 – 0.00600 confirms a macro breakout out of the multi-month Falling Wedge.
📈 Following confirmation, strong buying momentum could trigger a major recovery expansion toward higher historical horizontal levels:
🎯 Target 1: 0.00750 (Initial horizontal resistance)
🎯 Target 2: 0.01000 (Psychological level / mid-range target)
🎯 Target 3 (Chart Projection): 0.01282 (+180.80% measured move from breakout level)
🚀 Major Target 1: 0.01800 (Major intermediate high)
🚀 Major Target 2: 0.02500 (Macro structural swing high)
🔴 Bearish Scenario
⚠️ If the weekly candle fails to sustain above the upper trendline and faces rejection, price could re-enter the wedge structure.
📉 A fake out would lead to a retest of lower support levels within the wedge boundaries.
🎯 Key Support Levels:
🛡️ 0.00500: Immediate structural support
🛡️ 0.00450: Wedge lower trendline boundary
⚠️ 0.00350: Macro multi-year support low
❌ Bullish Invalidation: A weekly candle close below 0.00450.
🎯 Conclusion
📊 T/USDT is attempting a macro timeframe reversal out of a massive Falling Wedge on the 1W chart.
🟢 Bullish: Confirmed weekly close above 0.00580 → Opens path toward 0.00750, 0.01000, and the measured target at 0.01282 (+180.80%).
🔴 Bearish: Rejection at dynamic resistance → Retest of lower wedge support near 0.00500 – 0.00450.
⚠️ Macro weekly breakouts carry high reliability, but always wait for the weekly candle to close to avoid fake outs.
⚠️ Disclaimer: Not Financial Advice (NFA). Always Do Your Own Research (DYOR) before entering any trade.
💬 Are you accumulating $T on this weekly breakout, or waiting for a retest? Let us know your targets below! 👇
#T #TUSDT #threshold #Crypto #TradingView #WeeklyBreakout #FallingWedge #Altcoins #TechnicalAnalysis #Altcoins #CryptoTrading #Bullish #Bitcoin #DYOR #NFA