DAILY SIGNAL — SOL/USDT
Date: 25 Sep 2026 Timeframe: 1m Intraday Bias: Bullish continuation → breakout retest → upside Fibonacci liquidity
📊 Market Bias
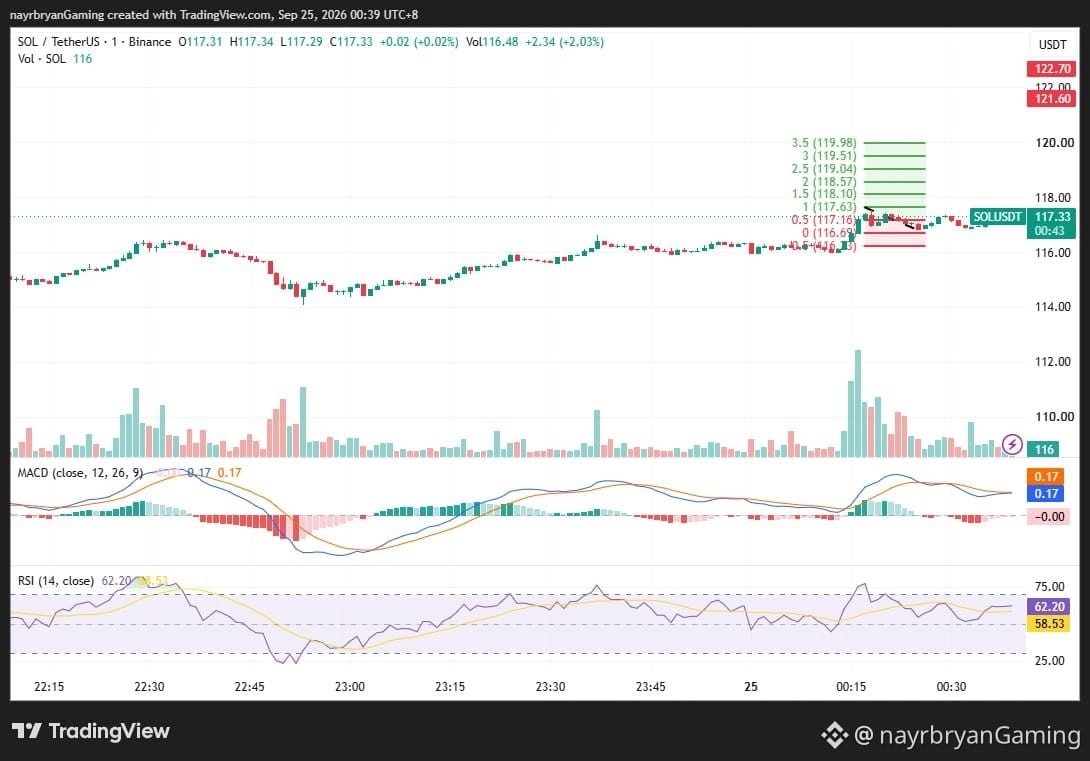
SOL is trading inside an ascending channel and remains above the key purple structure zone.
Price is currently around 117.44, with the chart showing a recent breakout above the 117.16 Fibonacci level.
The current consolidation is testing whether the reclaimed area can hold as short-term support.
🔹 Key Levels From Chart
Entry Zone — Long Reaction Bias: 116.86 → 117.16
Key Reclaim: 117.16
Immediate Resistance: 117.77
Invalidation: Below 116.46
🎯 Upside Fibonacci Targets
TP1 → 117.77 (1.0 Fib) TP2 → 118.10 (1.5 Fib) TP3 → 118.57 (2.0 Fib) TP4 → 119.04 (2.5 Fib) TP5 → 119.51 (3.0 Fib) TP6 → 119.98 (3.5 Fib)
📈 Technical Breakdown
SOL continues to trade within an ascending channel after recovering from the lower structure.
The latest impulsive move pushed price above the 117.16 Fibonacci area before entering a short consolidation.
The purple zone around the lower 116s remains an important structural area.
MACD remains positive, while RSI is around 64.80, indicating positive momentum without being at the 75 overbought boundary shown on the chart.
A sustained hold above 117.16 keeps the higher Fibonacci levels in focus.
A loss of 116.46 would weaken the current bullish structure and require reassessment.
🧠 Quick Insight
“After a breakout, the retest often matters more than the breakout candle.”
⚠️ Disclaimer
This is personal market analysis, not financial advice. This chart framework is for educational purposes only.
Always DYOR / DYODD, manage risk properly, and avoid emotional trading.
— @nayrbryanGaming #SOL #SOLUSDT #Crypto #Trading #TechnicalAnalysis #PriceAction #Fibonacci #Binance #DYOR #NFA #NoFOMO
Date: 25 Sep 2026 Timeframe: 1m Intraday Bias: Bullish continuation → breakout retest → upside Fibonacci liquidity
📊 Market Bias
SOL is trading inside an ascending channel and remains above the key purple structure zone.
Price is currently around 117.44, with the chart showing a recent breakout above the 117.16 Fibonacci level.
The current consolidation is testing whether the reclaimed area can hold as short-term support.
🔹 Key Levels From Chart
Entry Zone — Long Reaction Bias: 116.86 → 117.16
Key Reclaim: 117.16
Immediate Resistance: 117.77
Invalidation: Below 116.46
🎯 Upside Fibonacci Targets
TP1 → 117.77 (1.0 Fib) TP2 → 118.10 (1.5 Fib) TP3 → 118.57 (2.0 Fib) TP4 → 119.04 (2.5 Fib) TP5 → 119.51 (3.0 Fib) TP6 → 119.98 (3.5 Fib)
📈 Technical Breakdown
SOL continues to trade within an ascending channel after recovering from the lower structure.
The latest impulsive move pushed price above the 117.16 Fibonacci area before entering a short consolidation.
The purple zone around the lower 116s remains an important structural area.
MACD remains positive, while RSI is around 64.80, indicating positive momentum without being at the 75 overbought boundary shown on the chart.
A sustained hold above 117.16 keeps the higher Fibonacci levels in focus.
A loss of 116.46 would weaken the current bullish structure and require reassessment.
🧠 Quick Insight
“After a breakout, the retest often matters more than the breakout candle.”
⚠️ Disclaimer
This is personal market analysis, not financial advice. This chart framework is for educational purposes only.
Always DYOR / DYODD, manage risk properly, and avoid emotional trading.
— @nayrbryanGaming #SOL #SOLUSDT #Crypto #Trading #TechnicalAnalysis #PriceAction #Fibonacci #Binance #DYOR #NFA #NoFOMO