

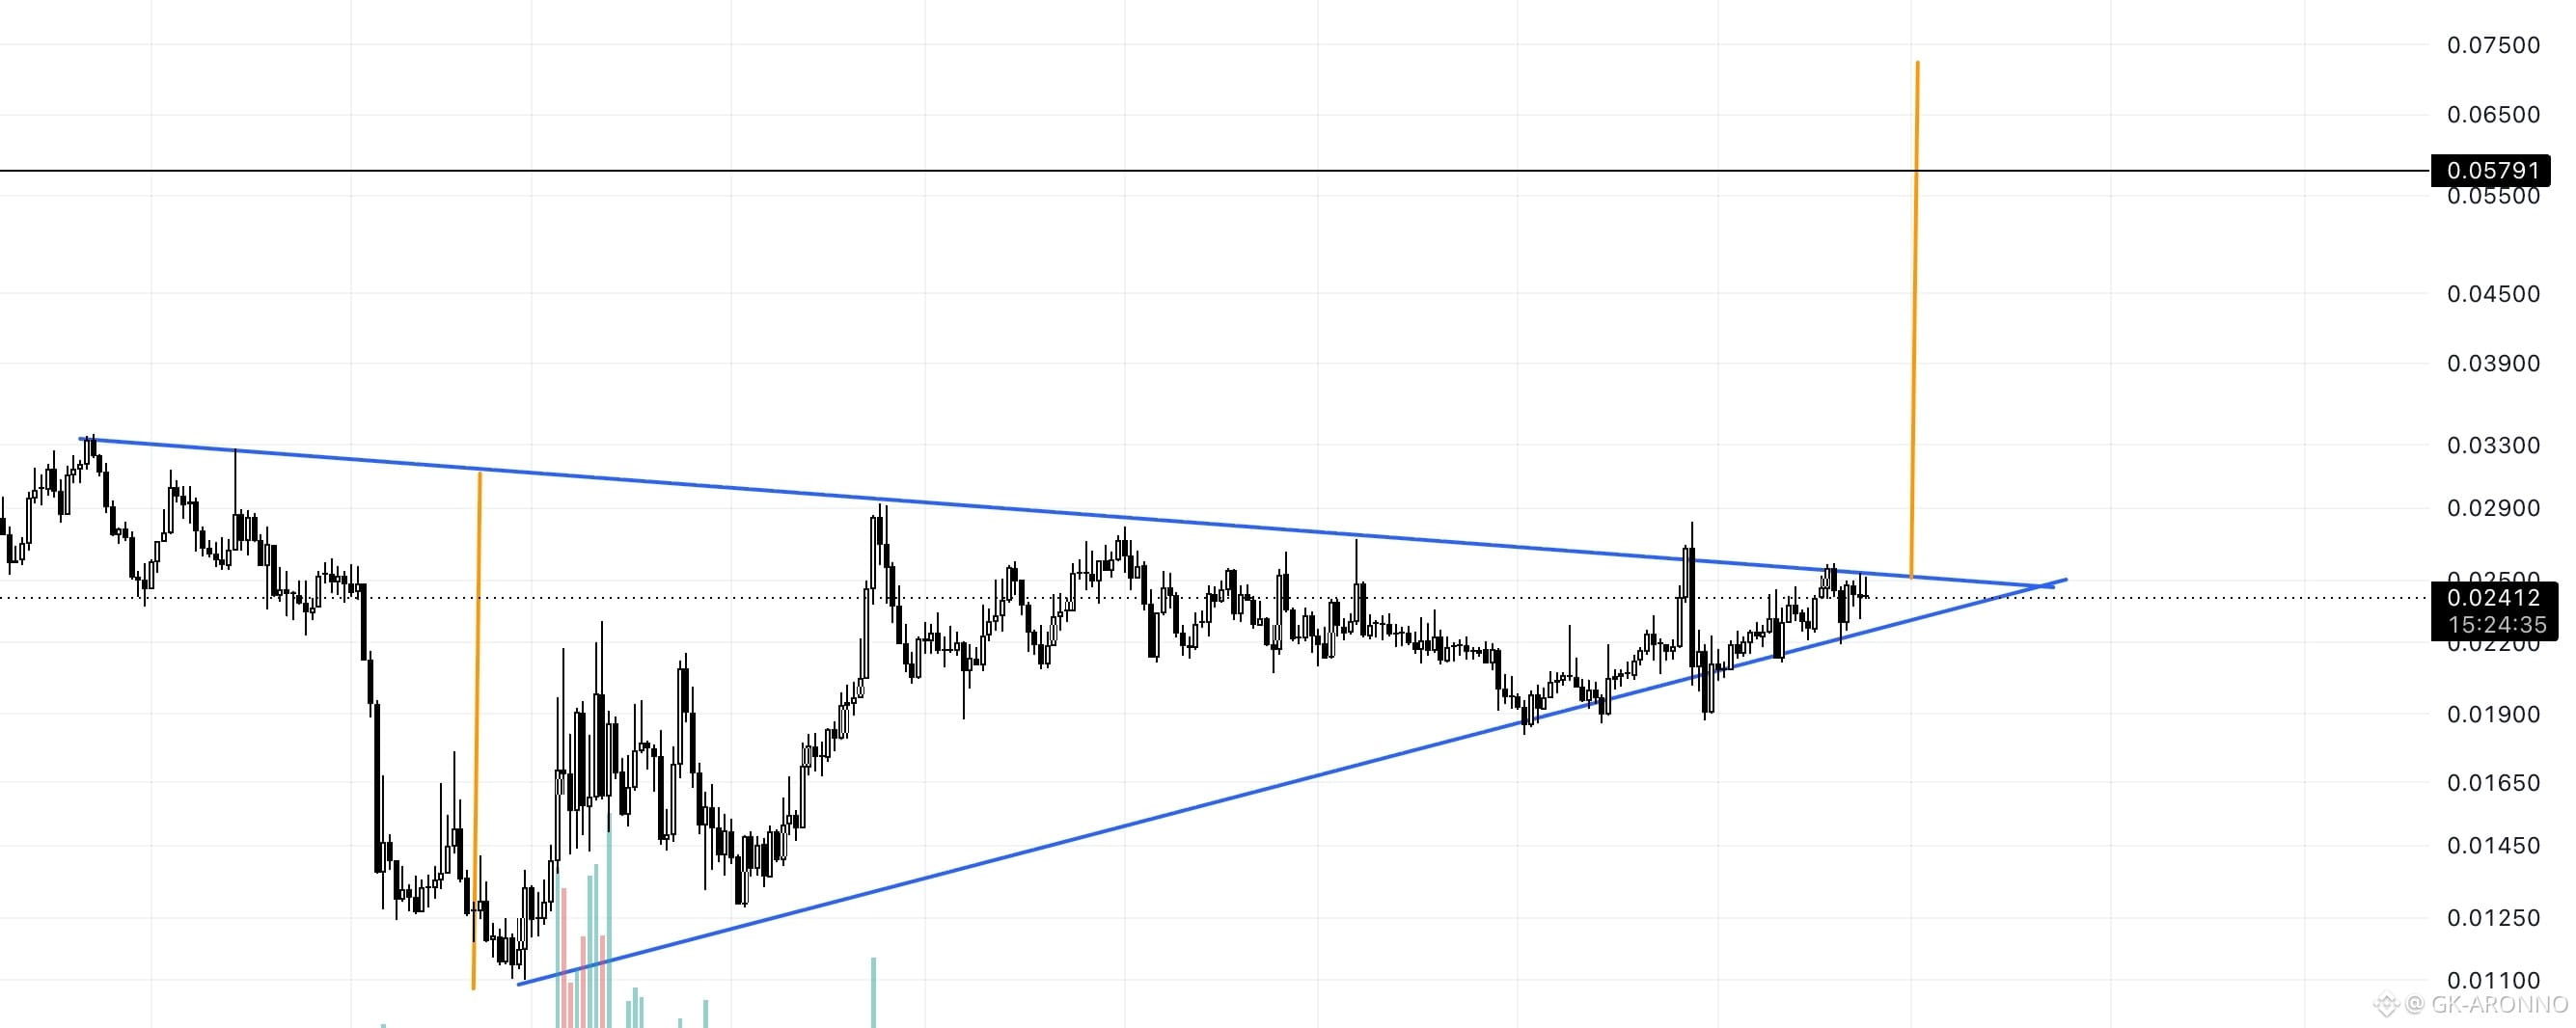

HUMA/USDT has been consolidating inside a large symmetrical triangle on the 1D chart, with price forming lower highs beneath descending resistance while maintaining a long sequence of higher lows along the rising support. The structure has been developing for several months and is now becoming very tight near the apex around $0.024–$0.025.
A confirmed daily breakout and hold above the upper trendline could trigger a strong bullish expansion, with $0.048 and $0.058 acting as key resistance areas and an extended target toward $0.070–$0.072.
A breakdown below the rising support would invalidate the bullish setup and increase the probability of a deeper correction.

HUMAUSDT
Perp
0.025679
+6.15%