


What caught my attention with XCN is not the 23% weekly rally.
It is how the market structure changed before the latest move.
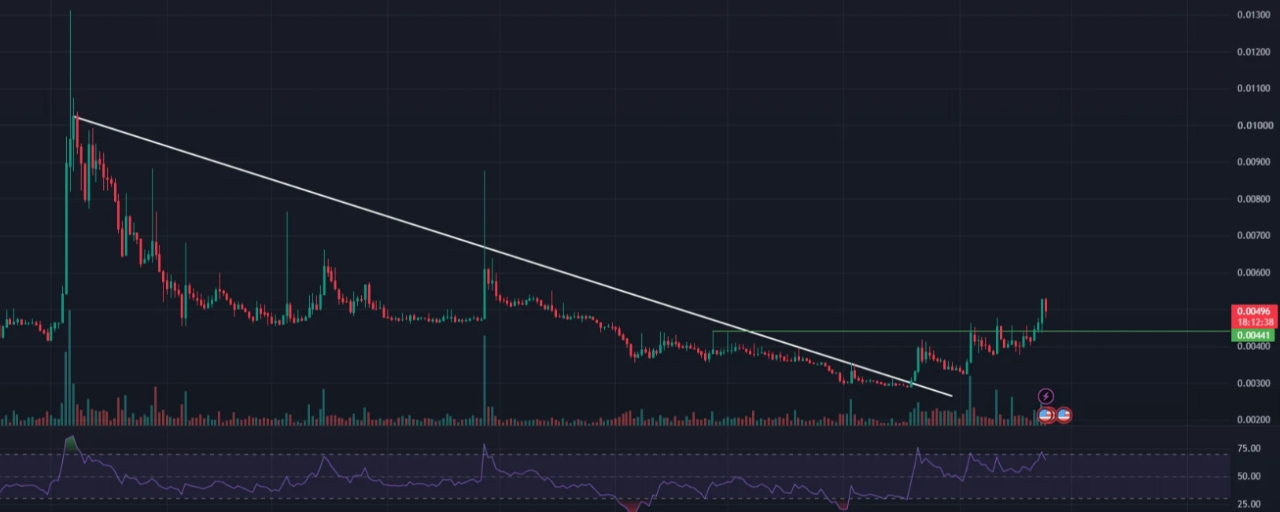
XCN spent most of the year inside a clear downtrend. Price fell from around $0.0131 to $0.00287 in August which was a decline of more than 78%.
Then something changed.
The long term trendline resistance was broken in August. After that XCN also reclaimed the $0.00441 swing resistance in September.
That combination matters because the market was no longer making the same lower highs that defined the previous downtrend.
The recent Chain.com deal also gives the move a fundamental narrative. Onyx acquired Chain.com which operates infrastructure for stablecoin payments. Onyx Mesh also went live on the Onyx Layer 1 in July.
At the same time Onyx Explorer data showed rising activity and new users as broader crypto sentiment improved.
But I would still separate the narrative from the chart.
XCN has already moved sharply higher and the recent drop from $0.00531 to around $0.00480 shows that sellers are active after the rally.
For me the important area now is $0.00409 to $0.00435.
That zone lines up with the Fibonacci golden pocket and could become the real test of whether buyers are willing to defend the new structure.
The bigger level is $0.00376.
As long as XCN holds above that higher low the broader recovery structure remains intact.
If buyers reclaim $0.00531 then the next areas I would watch are around $0.00568 and $0.00627.
But I would not chase the move simply because XCN is up 30% in a month.
The more useful signal would be a pullback that holds support and then creates another higher high.
That would tell me the trendline breakout was not just a short term liquidity move.
Right now $0.0048 is the immediate area.
$0.00409 to $0.00435 is the deeper test.
And $0.00376 is where the current structure starts becoming much harder to defend.