

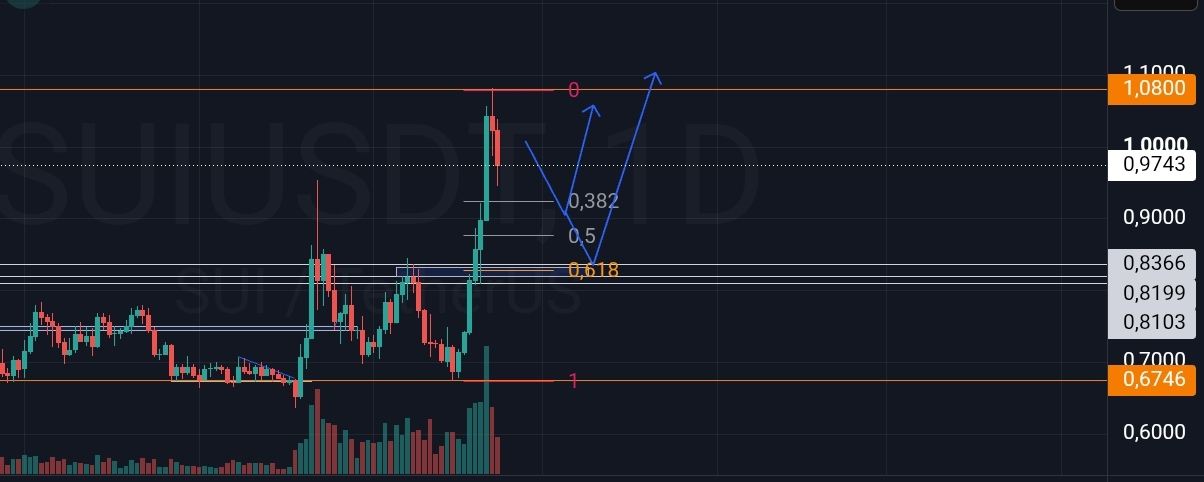

The crypto market is once again showing interesting dynamics on the SUI/USDT pair. Based on the daily chart observed, SUI’s price action displays a fairly clear pattern supported by Fibonacci Retracement levels. This article systematically breaks down the analysis, covering price structure, key levels, volume, and potential future scenarios.
Price Structure and Primary Trend
Overall, the chart shows a medium-term bullish trend. Price previously consolidated in the lower area before surging sharply higher, forming strong green candles that approached the 1.0800 level. Currently, the price is trading around 1.0051 with a daily correction of approximately -1.81%.
The recent high is marked as Fibonacci level 0 (around 1.0800), while the previous significant low sits at level 1 (0.6746). This movement indicates that SUI successfully broke out of a sideways phase and entered a relatively aggressive upward expansion. However, after reaching the peak, signs of natural profit-taking have appeared.
Fibonacci Retracement Levels as the Main Guide
Fibonacci Retracement is the primary tool used on this chart. The drawn levels include:
0** at 1.0800 (recent high)
0.382**
0.5**
0.618** around 0.8366
The dark blue zone in the 0.81–0.84 area appears to act as a strong support that previously functioned as resistance. The 0.618 Fibonacci level coincides with this zone, making it a highly notable area. Additionally, there is horizontal support around 0.75 and the 0.6746 level as the major low.
The blue arrows on the chart illustrate a potential scenario: price corrects deeper toward the 0.5 to 0.618 zone, then rebounds strongly toward new highs above 1.0800. This pattern is common in bullish trends, where a healthy correction is needed before the upward move continues.
Volume Analysis
Volume showed a significant increase when price rallied sharply toward 1.0800, indicating strong buyer participation. However, during the current correction phase, volume has tended to decrease, suggesting that selling pressure is not yet extreme. Declining volume during a pullback often signals that the primary trend remains intact, provided price does not break important support levels on high volume.
Support, Resistance, and Key Zones
Major resistance**: 1.0800 (Fibonacci level 0). A solid breakout above this level on strong volume could open the path toward 1.15–1.20.
Nearest support**: The 0.95–1.00 psychological area and the 0.81–0.84 zone (0.618 Fibonacci + blue zone).
Deeper support**: 0.75 and 0.6746.
The 0.81–0.84 zone is critical. If price holds here and forms a reversal pattern (such as a pin bar or bullish engulfing), the probability of a rebound increases significantly.
Potential Price Scenarios
Bullish Scenario (primary, aligned with the chart’s projection)
Price undergoes a controlled correction toward the 0.5–0.618 Fibonacci area (around 0.85–0.83). After finding support, price rebounds and attempts to break above 1.0800. Subsequent targets could reach 1.15 or higher, following the previous bullish momentum.
Bearish Scenario
If the 0.618 zone fails to hold and price breaks below 0.81 on increasing volume, the risk of a deeper decline toward 0.75 or even 0.67 becomes open. In this case, the medium-term bullish structure could be disrupted.
Conclusion and Notes
The SUI/USDT daily chart is currently in a corrective phase following a sharp rally. The Fibonacci Retracement levels provide a clear guide to potential support areas. The arrow projections on the chart suggest that a pullback toward the 0.618 level remains within a healthy range before a possible continuation of the uptrend.
Traders are advised to monitor price reactions in the 0.81–0.84 zone along with volume confirmation. Always practice proper risk management, as the crypto market is highly volatile. This analysis is purely technical based on the available chart and does not constitute investment advice. Conduct your own research and adjust according to your personal risk profile.
With a clear understanding of these key levels, market participants can develop more measured strategies for entries, exits, and position management.