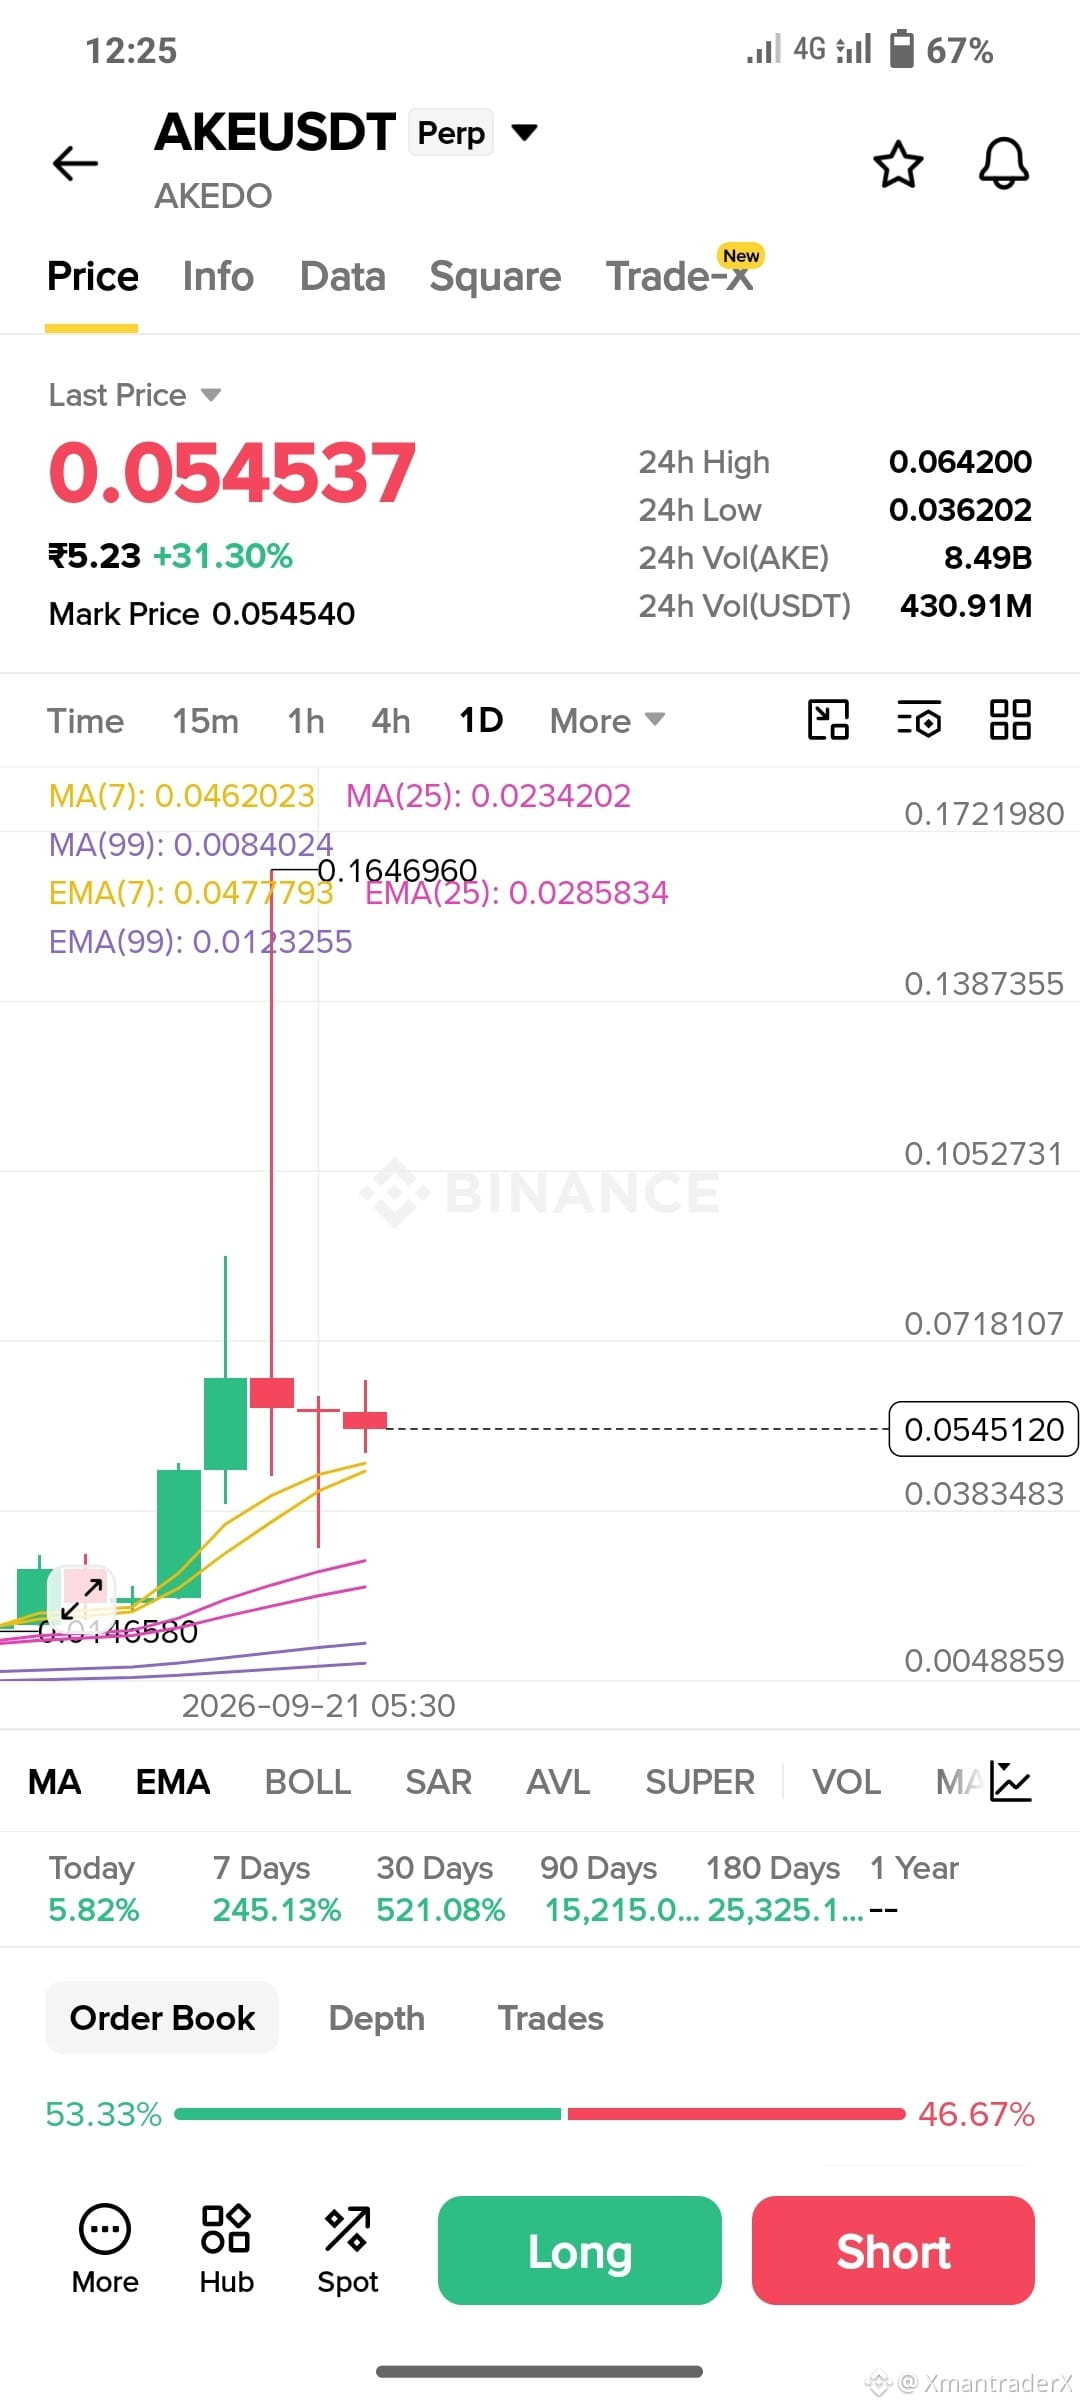
Based on the 1D chart in your screenshot, AKEUSDT is showing a bullish trend with a short-term pullback/consolidation.
📈 Trend Analysis — AKEUSDT
Current price: ~0.05454
24H high: 0.06420
24H low: 0.03620
MA(7): 0.04620
EMA(7): 0.04770
EMA(25): 0.02858
EMA(99): 0.01233
Why the trend is bullish:
Price is still clearly above the 7-day, 25-day and 99-day moving averages. The MA/EMA structure is also strongly upward, showing that the broader daily momentum remains positive.
Key levels
Level Importance
0.0642 Immediate resistance / recent high
0.0718 Next resistance if breakout occurs
0.0545 Current price
0.047–0.046 Important short-term support
0.0383 Stronger support
0.0285 Major EMA-25 support
🔎 What I would watch
Bullish scenario:
If AKE breaks and gets a daily candle close above 0.0642, that would indicate renewed upside momentum. The next chart area to watch is around 0.0718.
Pullback scenario:
If price falls toward 0.047–0.046 and holds, the bullish structure remains relatively intact.
Bearish warning:
A decisive daily close below 0.046 would weaken the short-term trend; below 0.0383 would be a much more significant deterioration.
⚠️ Since this is AKEUSDT Perpetual, don't use the 24H +31% move as a reason to chase a long. After a sharp rise, volatility can be extreme and leverage can liquidate positions quickly.
Overall chart structure: 🟢 Bullish → currently consolidating/pulling back.
For a safer entry, I'd watch how price behaves around 0.047–0.046 or wait for a confirmed breakout above 0.0642, rather than entering simply because the price is rising.#AKEUpdate #AKETRADE #InvestSmart
📈 Trend Analysis — AKEUSDT
Current price: ~0.05454
24H high: 0.06420
24H low: 0.03620
MA(7): 0.04620
EMA(7): 0.04770
EMA(25): 0.02858
EMA(99): 0.01233
Why the trend is bullish:
Price is still clearly above the 7-day, 25-day and 99-day moving averages. The MA/EMA structure is also strongly upward, showing that the broader daily momentum remains positive.
Key levels
Level Importance
0.0642 Immediate resistance / recent high
0.0718 Next resistance if breakout occurs
0.0545 Current price
0.047–0.046 Important short-term support
0.0383 Stronger support
0.0285 Major EMA-25 support
🔎 What I would watch
Bullish scenario:
If AKE breaks and gets a daily candle close above 0.0642, that would indicate renewed upside momentum. The next chart area to watch is around 0.0718.
Pullback scenario:
If price falls toward 0.047–0.046 and holds, the bullish structure remains relatively intact.
Bearish warning:
A decisive daily close below 0.046 would weaken the short-term trend; below 0.0383 would be a much more significant deterioration.
⚠️ Since this is AKEUSDT Perpetual, don't use the 24H +31% move as a reason to chase a long. After a sharp rise, volatility can be extreme and leverage can liquidate positions quickly.
Overall chart structure: 🟢 Bullish → currently consolidating/pulling back.
For a safer entry, I'd watch how price behaves around 0.047–0.046 or wait for a confirmed breakout above 0.0642, rather than entering simply because the price is rising.#AKEUpdate #AKETRADE #InvestSmart