


This is a 1-minute trading chart for $SOPH - the volume label at the bottom says Vol(SOPH). The watermark says Binance, so this is likely a crypto token chart shown in a stock-style app.
Here is what you are looking at:
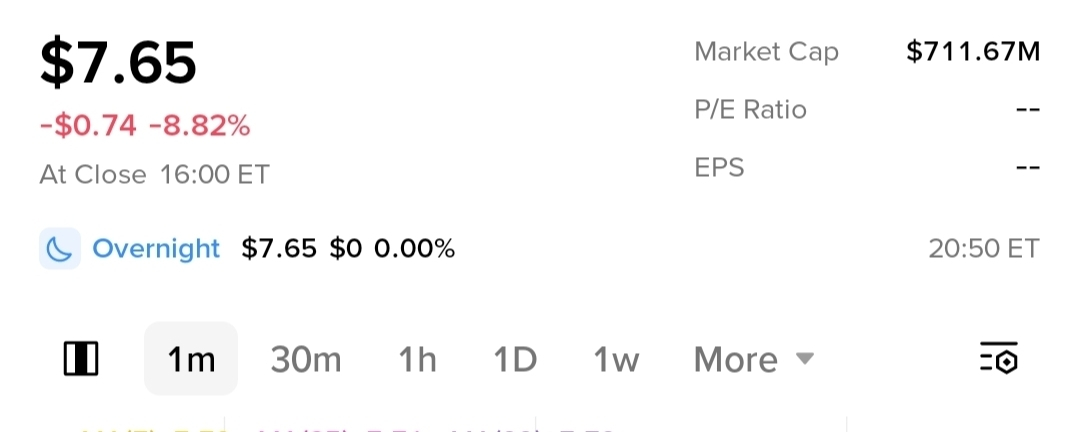
1. Top header - The price today
$7.65 - current / last price
-$0.74 -8.82% in red - it is down 74 cents today, almost 9%. That's a big drop for one day.
At Close 16:00 ET - this is the official stock market close time in New York.
Market Cap $711.67M - total value of all coins/tokens.
P/E Ratio -- EPS -- - blank because crypto tokens don't have earnings like companies, so those don't apply.
Overnight $7.65 $0 0.00% - in after-hours trading at 20:50 ET the price hasn't moved.
2. Middle - The price chart (Candlesticks)
You have 1m selected, so each candle = 1 minute of trading. The x-axis shows time: 2026-09-10 00:47 to 01:00 - so this is a ∼15 minute window tonight.
Red candle = price closed lower than it opened that minute - selling.
Green candle = price closed higher than it opened - buying.
You can see high volatility: a big red drop on the left, then green recovery, then red selling again near the end. The last candle closed at $7.65.
The 3 lines on top are Moving Averages (MA):
MA(7): 7.70 - yellow line, average of last 7 minutes
MA(25): 7.71 - pink line, average of last 25 minutes
MA(99): 7.79 - purple line, average of last 99 minutes
All 3 MAs are above the current price ($7.65 < $7.70 < $7.71 < $7.79). That is a bearish short-term signal - price is trading below its recent averages and the long MA(99) is sloping down.
3. Bottom - Volume
Vol(SOPH): 150 - volume in this last minute is very low.
MA(5): 7.42K MA(10): 5.57K - average volume of last 5 and 10 minutes.
The two big red bars on the left and near 01:00 are volume spikes - a lot of selling happened in those minutes, which matches the big red price candles. The rest of the time volume is tiny.
The buttons below: MA, EMA, BOLL, SAR, AVL, SUPER, VOL - these are indicators you can turn on. MA is currently active.
In simple terms: SOPH had a very bad day -8.82%, and in this 15-minute window you are watching, it tried to recover but failed and is finishing at its low of $7.65 on low volume after two heavy sell-offs. The trend on the 1m chart is down.
This is not financial advice - 1-minute charts are extremely noisy and mostly used by day-traders.#BrentCrudeTops$100 #RippleLobbiesToAdvanceCLARITYActVote