


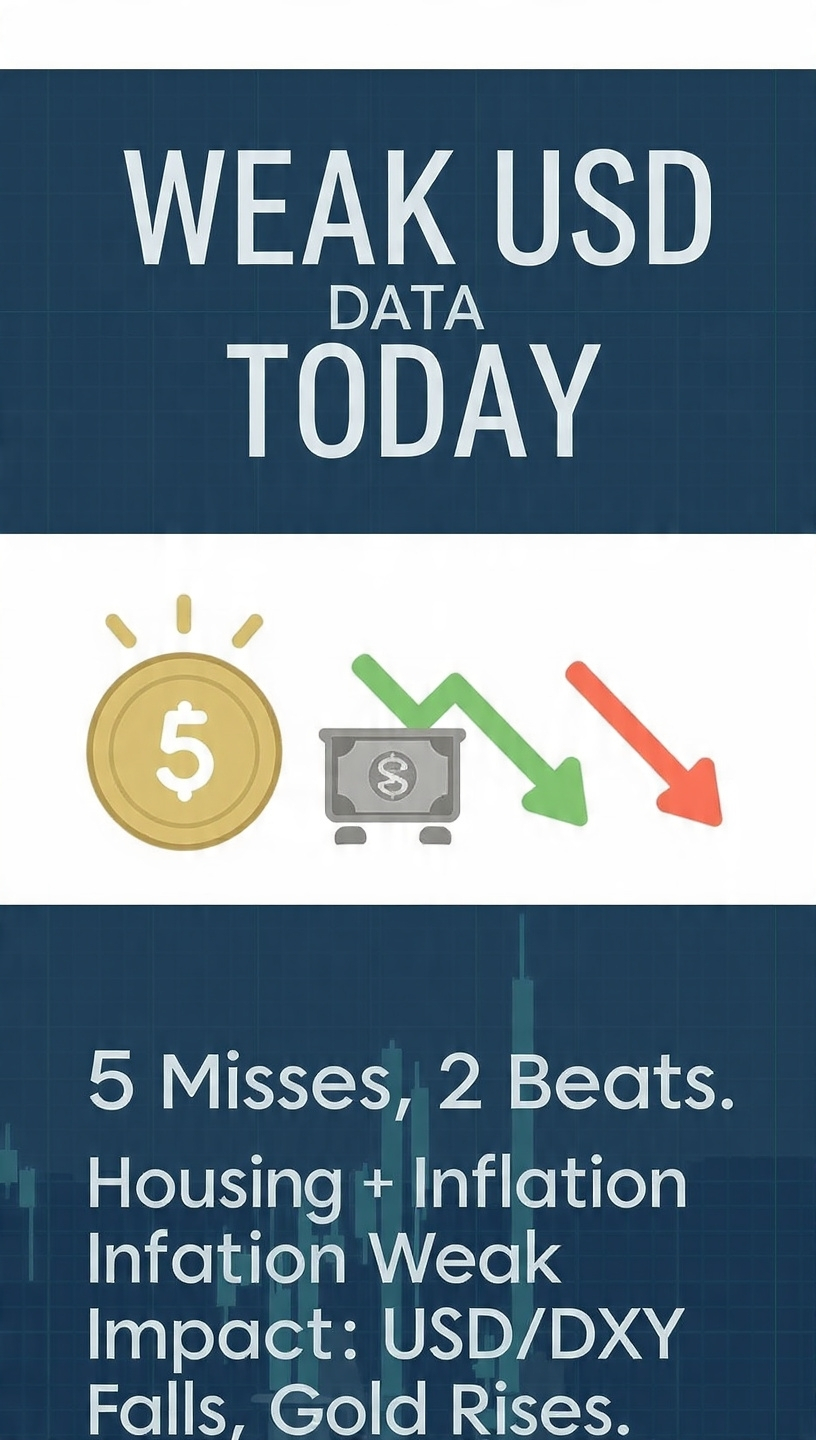
Données faibles partout → USD baisse → l’or monte — Voici l’analyse complète*
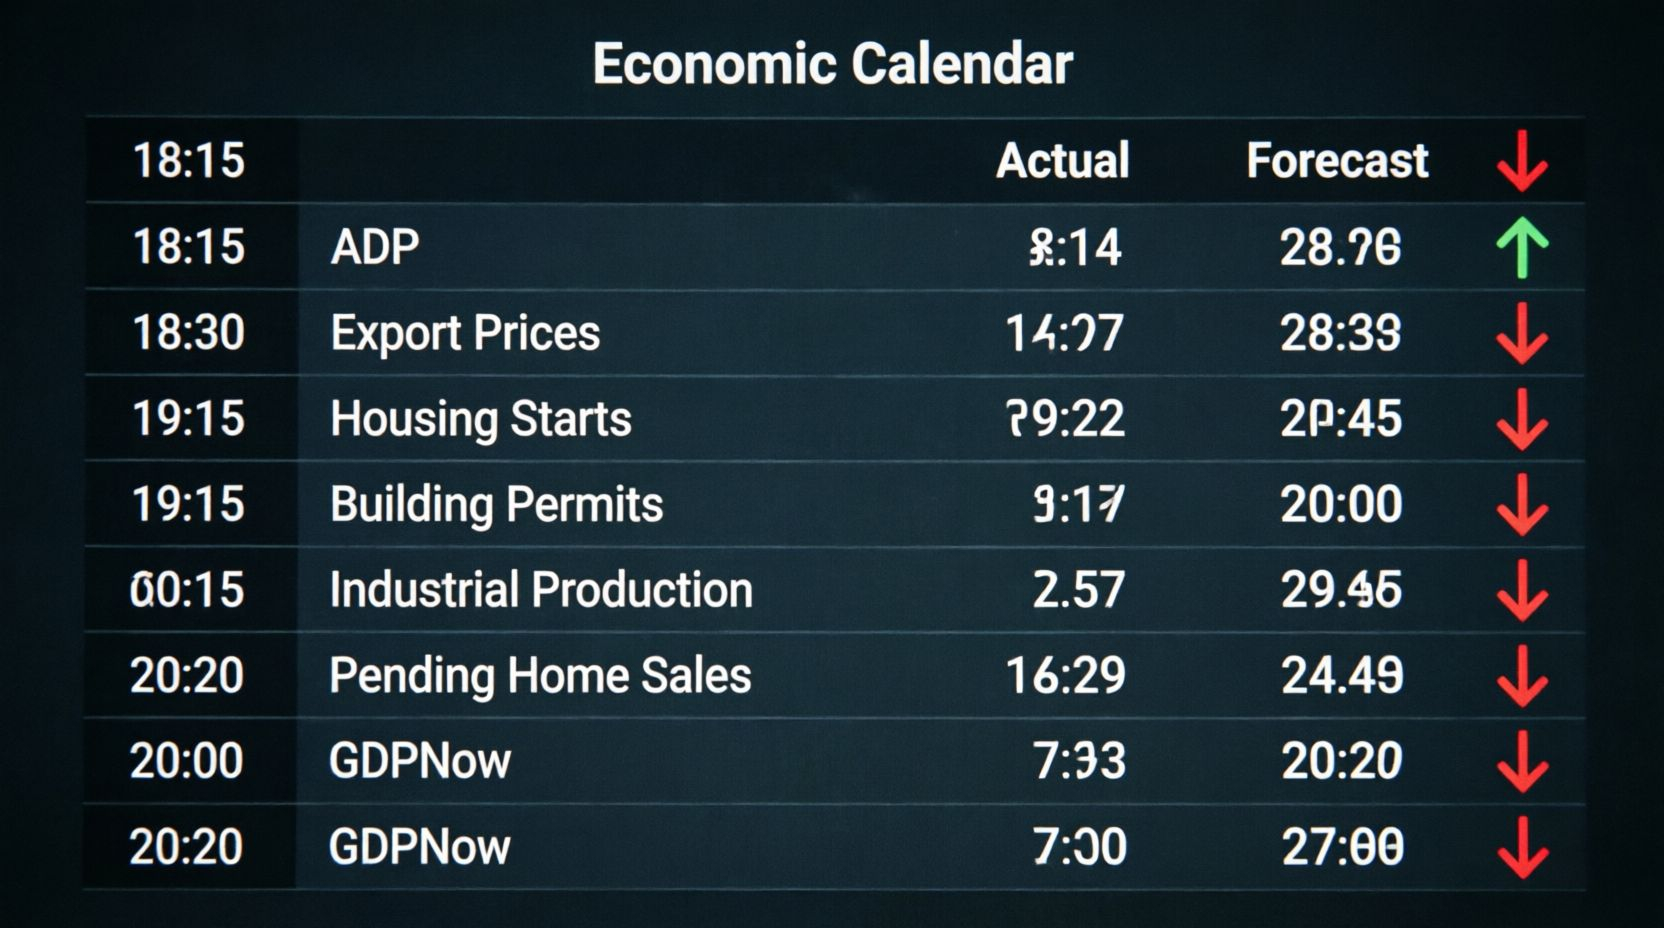
# 📋 Toutes les données d’aujourd’hui en un coup d’œil
| Heure | Événement | Réel | Prévision | Précédent | Biais |
| 18:15 | Variation de l’emploi ADP | 9,50K | — | 8,30K | 🟡 Légèrement solide |
| 18:30 | Indice des prix à l’exportation (MoM) | -1,3 % | 0,2 % | -0,7 % | 🔴 En moins bien |
| 18:30 | Mises en chantier (MoM) | -12,4 % | — | +19,7 % | 🔴 En moins bien |
| 18:30 | Mises en chantier (Total) | 1.239M | 1.340M | 1.415M | 🔴 En moins bien |
| 18:30 | Indice des prix à l’importation (MoM) | -0,4 % | 0,1 % | -0,3 % | 🔴 Légèrement faible |
| 18:30 | Permis de construire | 1.443M | 1.370M | 1.374M | 🟢 En mieux |
| 19:15 | Production industrielle (YoY) | 1,08 % | 1,29 % | 1,29 % | 🔴 Faible |
| 19:15 | Production industrielle (MoM) | 0,2 % | 0,3 % | 0,3 % | 🔴 Faible |
| 20:00 | Ventes de maisons en attente (MoM) | -2,3 % | 0,1 % | -4,8 % | 🔴 Faible |
| 20:20 | Atlanta Fed GDPNow (T3) | 4,0 % | 4,3 % | 4,3 % | 🔴 Croissance abaissée |
## 🧠 Règle simple — Comment lire ces chiffres
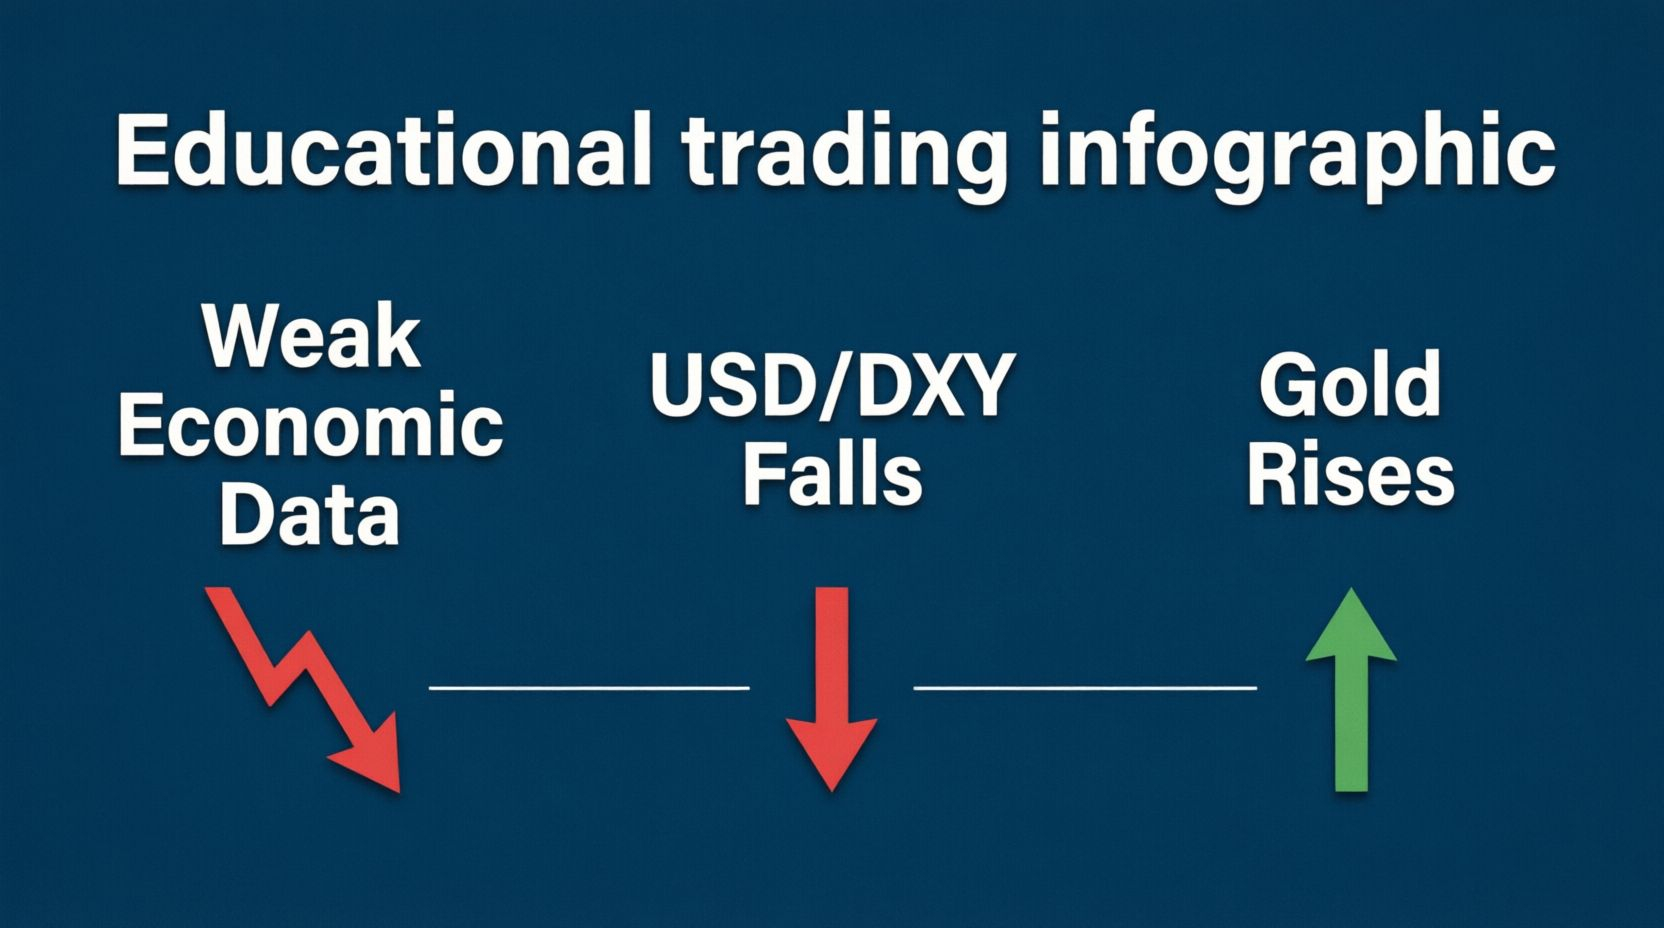
- 🟢 **Réel > Prévision** = Économie solide → USD en hausse → Or/Pétrole en baisse
- 🔴 **Réel < Prévision** = Économie faible → USD en baisse → Or/Pétrole en hausse
- 🟡 **Proche des prévisions** = Mouvement mitigé / latéral
## 📉 Verdict d’aujourd’hui : données faibles partout
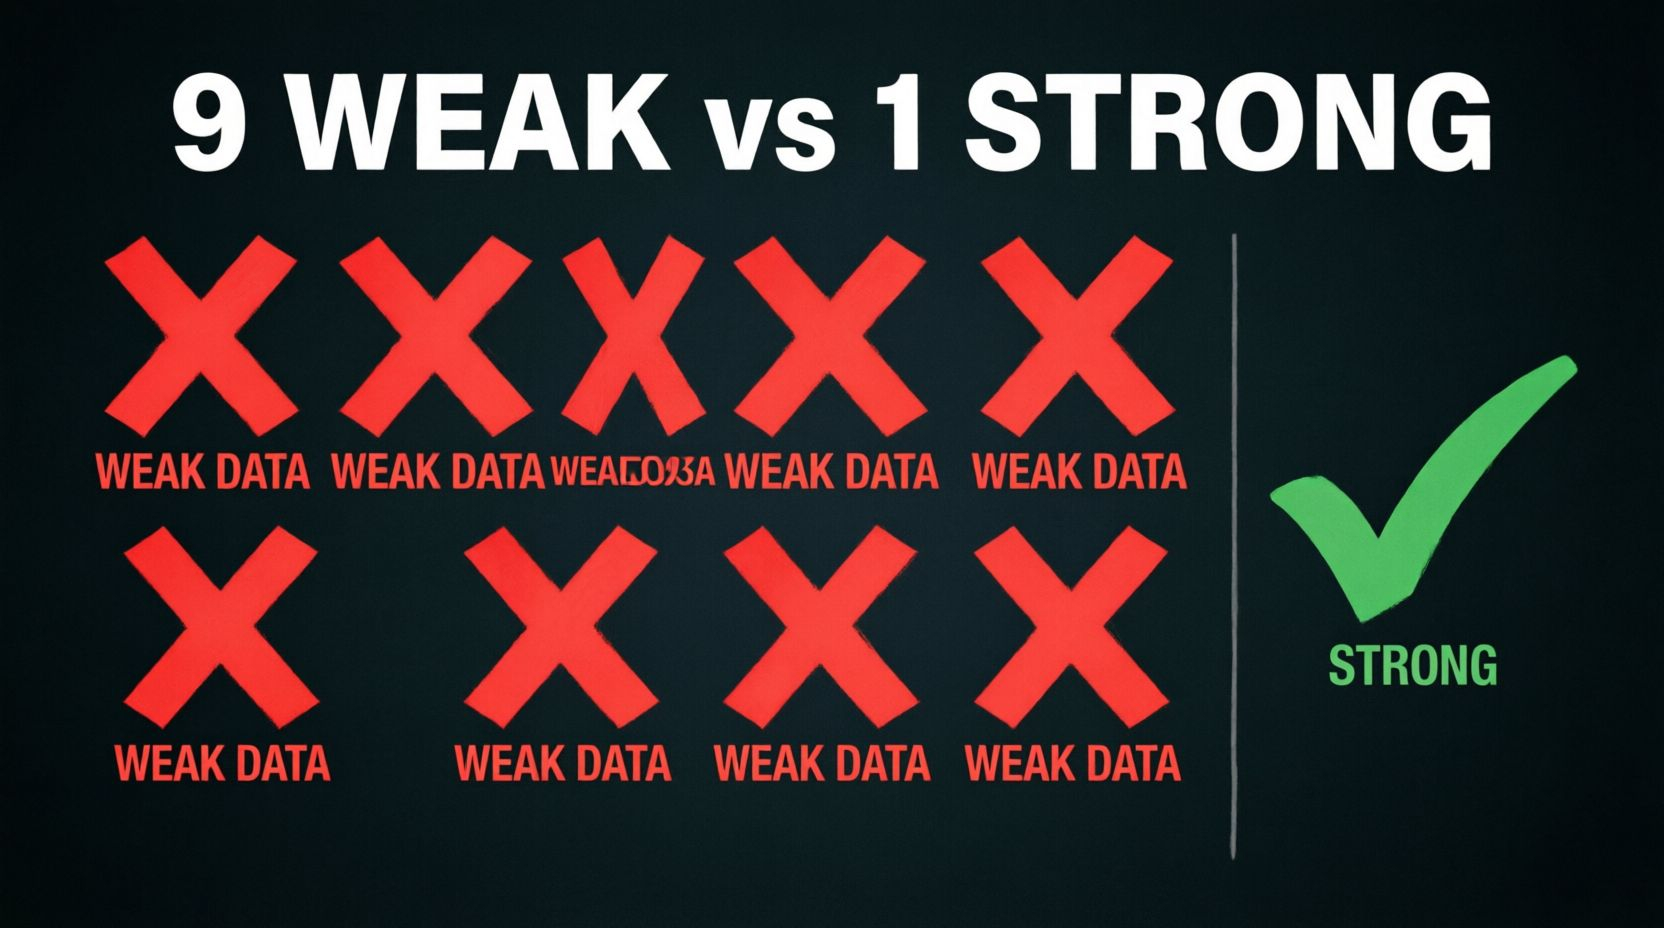
Neuf publications sur dix sont arrivées en dessous des attentes. Seuls les permis de construire ont fait mieux — et ce sont des données logement tournées vers l’avenir, pas la croissance actuelle.
- **Prix à l’exportation -1,3 %** → nettement sous la prévision → refroidissement de l’inflation → la Fed pourrait couper plus tôt
- **Mises en chantier -12,4 %** → forte baisse après la hausse du mois dernier → l’immobilier ralentit rapidement
- **Production industrielle** en baisse → la fabrication ne progresse pas comme prévu
- **GDPNow abaissé à 4,0 %** → estimation de croissance revue à la baisse
- **Ventes de maisons en attente -2,3 %** → la demande d’achat s’affaiblit
**Conclusion :** l’économie américaine montre des signes de ralentissement. Une croissance plus lente signifie généralement un dollar plus faible et un or plus élevé.
📸 *Image nécessaire : tableau de bord récapitulatif — 🔴 9 publications faibles vs 🟢 1 fort.*
---
## 📈 Ce que cela signifie pour chaque marché
### 🪙 Or → 🟢 Haussier (en hausse)
Données faibles → USD baisse → l’or devient moins cher pour les acheteurs mondiaux → la demande augmente. Une croissance plus faible augmente aussi les chances de baisses de taux plus précoces de la Fed, ce qui, historiquement, soutient l’or.
**Attente :** l’or va probablement viser 4 400 $+ avec ces données faibles.
### 🛢️ Pétrole → ⚖️ Mitigé / Légèrement haussier
Deux forces opposées sont en jeu :
- ✅ USD plus faible → le pétrole devient moins cher → soutient les prix
- ❌ Logement faible, industrie manufacturière et données de PIB → économie plus lente → moins de carburant demandé → pression
**Attente :** latéral à légère hausse. Il faut des données d’inventaires pour une direction plus claire.
### 💵 Dollar américain (DXY) → 🔴 Baissier (en baisse)
Quand les données ratent constamment les attentes, les traders anticipent une économie plus faible et des baisses de taux plus tôt de la Fed — les deux sont baissiers pour le dollar.
**Attente :** le DXY sous pression, ce qui soutient les matières premières globalement.
: Or 🟢 en hausse, Pétrole ⚖️ mitigé, USD 🔴 en baisse.*
---
## 🧠 Comment trader ça — Mon plan
1. **Avant la publication :** vérifiez la prévision — sachez quel chiffre surveiller.
2. **Au moment de la publication :** comparez immédiatement le réel à la prévision.
- Plus bas que la prévision → acheter l’or / vendre l’USD
- Plus haut que la prévision → vendre l’or / acheter l’USD
3. **Après la publication :** ne poursuivez pas — attendez 5 à 15 minutes que le pic initial se stabilise.
4. **Confirmation :** si deux ou plusieurs annonces à fort impact vont dans la même direction, le mouvement a davantage de conviction.
Les neuf publications faibles d’aujourd’hui indiquent un biais directionnel fort — mais attendez quand même que le marché montre clairement la voie en premier. 🛡️
## ⚠️ Rappels importants
- Un seul point de données n’est pas une nouvelle tendance — mais beaucoup de chiffres faibles ensemble sont un signal fort.
- L’USD a tendance à bouger en premier, l’or suit — regardez le graphique du DXY avec les actualités.
- Les marchés peuvent s’inverser très vite — si les données de demain sont solides, le mouvement d’aujourd’hui peut disparaître.
- Utilisez toujours un stop-loss — les communiqués provoquent des pics rapides dans les deux directions.
---
*Ceci est une analyse personnelle, pas un conseil financier. Faites toujours vos propres recherches. Les données économiques créent de la volatilité — tradez avec une gestion du risque appropriée.*
**Tags :** #USD #DXY #GOLD #OIL #XAUUSD #EconomicCalendar #NewsTrader #MarketAnalysis
---
## 📋 Liste de contrôle de l’image (5 au total)
1. En-tête — calendrier + tableau de bord du marché (1920×500)
2. Capture d’écran complète du calendrier (vos deux images combinées)
3. Infographie règle simple — solide/faible → USD → effet sur l’or
4. Résumé — 🔴 9 faibles vs 🟢 1 fort
5.
Impact sur le marché — Or en hausse / Pétrole mitigé / USD en baisse
Avertissement, ce n’est que mon avis : ce n’est pas la sécurité financière, cela aurait pu arriver ou non, mais ce sont les règles