

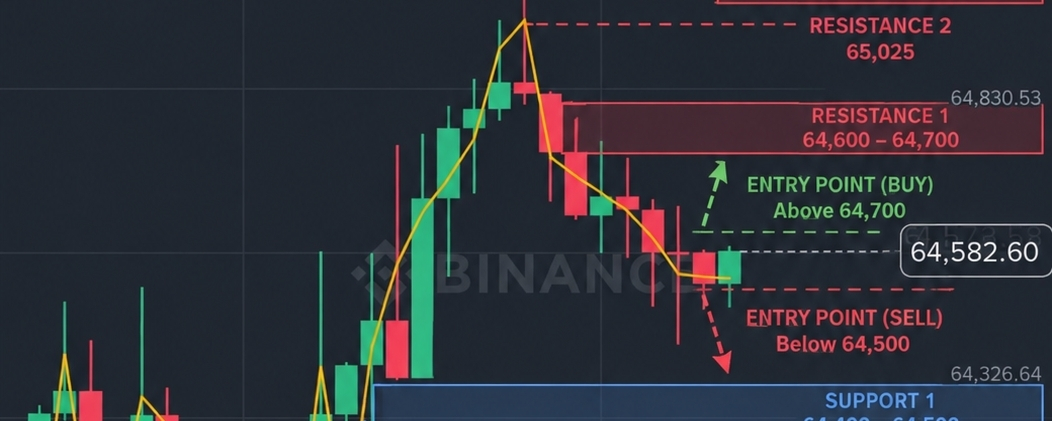

Analyse du graphique BTC/USDT sur 1H
D’après votre graphique BTC/USDT sur 1 heure, voici mon analyse technique :
Tendance : La tendance à court terme est légèrement baissière. Le prix a été rejeté vers 65 025 et a commencé à évoluer à la baisse.
MACD : Le MACD est en territoire négatif, indiquant un affaiblissement de l’élan haussier.
Support : La zone de support clé se situe autour de 64 500–64 400. Si ce niveau se brise, le prix pourrait baisser vers 64 200, puis 63 900.
Résistance : La première résistance majeure se situe entre 64 800 et 65 000. Une clôture solide en bougie 1H au-dessus de cette zone pourrait signaler un mouvement haussier.
Idée de trade (Basée uniquement sur le graphique) :
Acheter : Envisagez d’acheter si une forte bougie de 1 heure clôture au-dessus de 65 000.
Vendre : Envisagez de vendre si une bougie de 1 heure clôture en dessous de 64 500.
Utilisez toujours un stop-loss et évitez d’entrer dans une transaction sans confirmation.$BTC 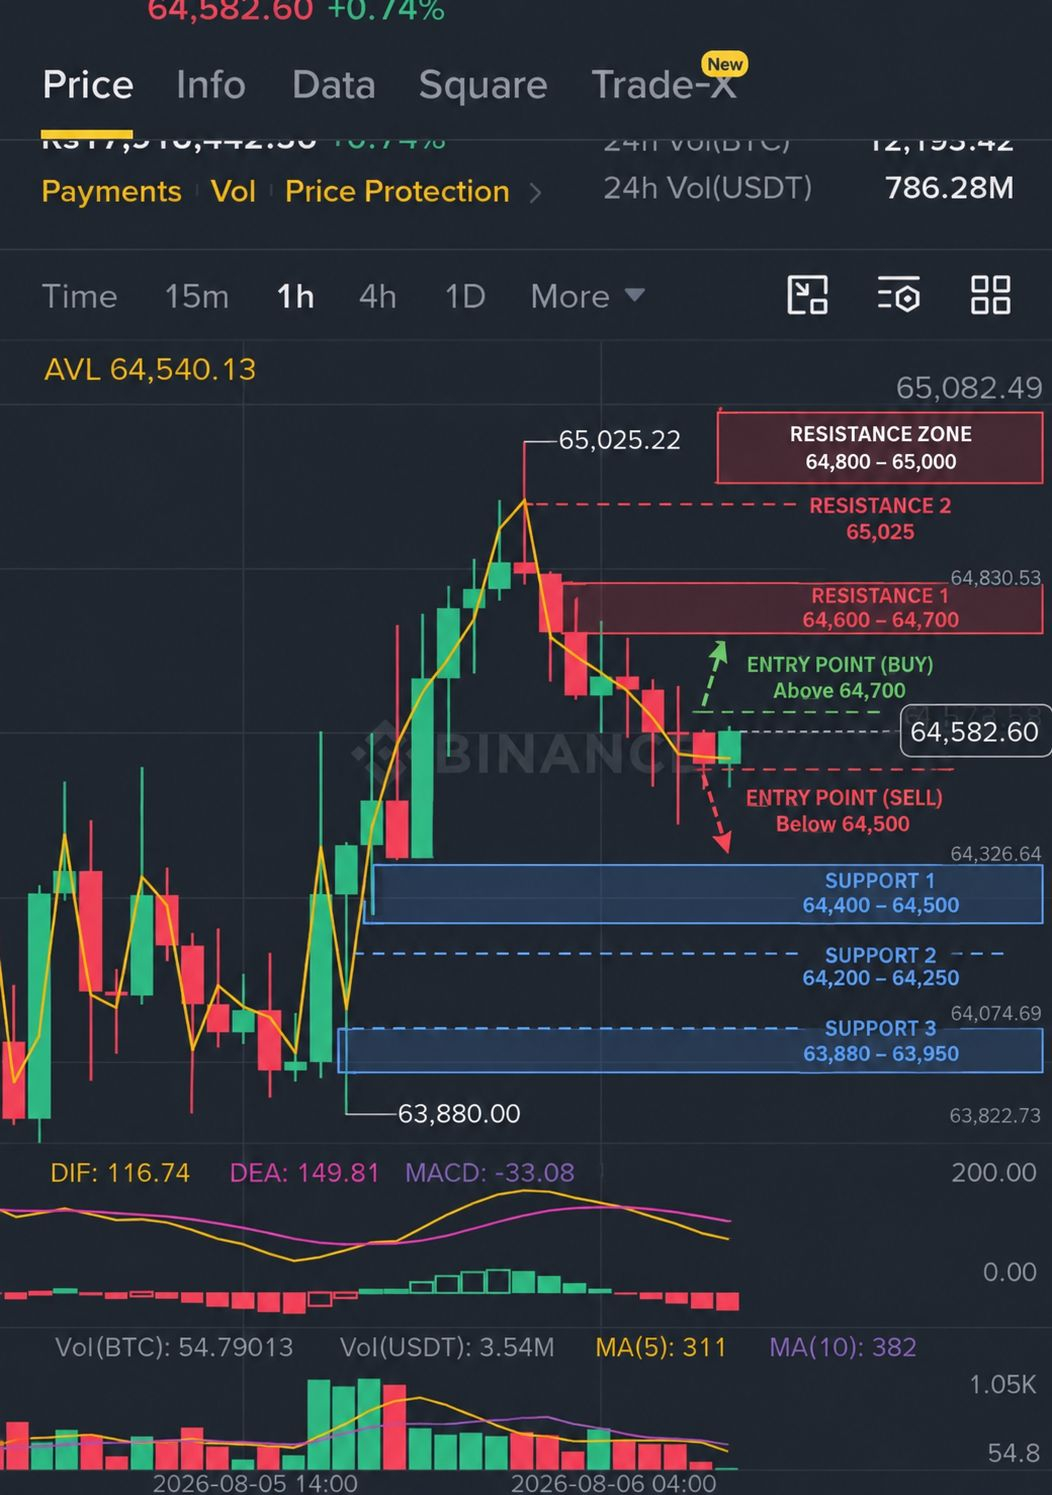

#ADPJulyPrivatePayrollsMissedExpectations #BTC70K✈️ #BinanceSquareTalks #bitcoin