🔥 $AVA Montrer sa force — Rupture ou faux signal haussier ?
⏰ Horizon : 1H (analysé uniquement à partir du graphique importé)
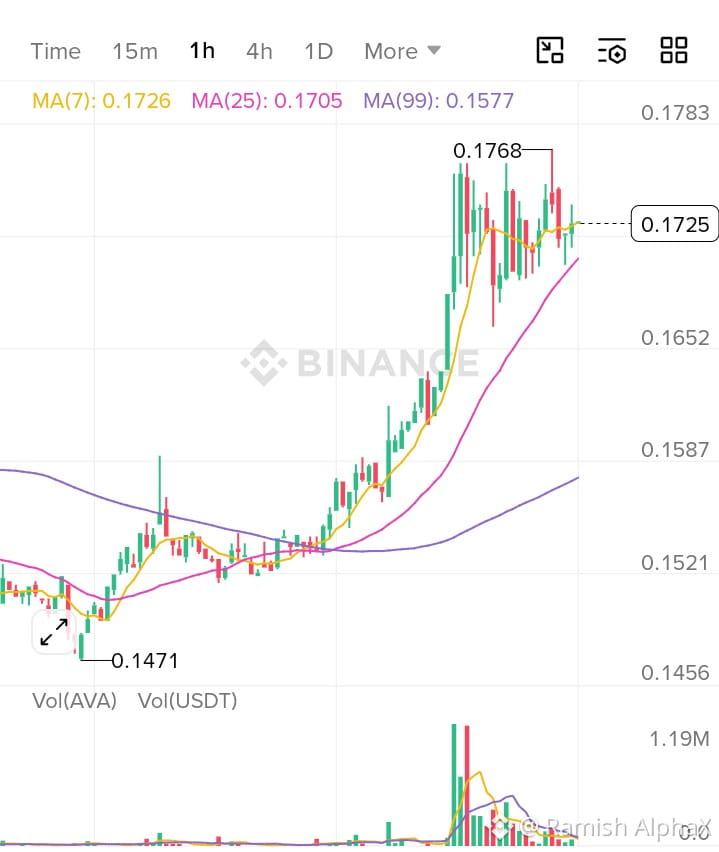
📊 Biais du marché : Haussier (prudemment haussier) Le prix évolue au-dessus des MM(7), MM(25) et MM(99), confirmant une structure haussière à court terme. La dynamique reste positive, mais le prix approche une résistance locale clé autour de 0.1768.
🎯 Configuration du trade
Trade : LONG (après confirmation)
Zone d’entrée : 0.170 – 0.173 (repli) ou après une cassure confirmée au-dessus de 0.177
Stop Loss : 0.166
TP1 : 0.177
TP2 : 0.183
TP3 : 0.190
Risque : Rendement : Environ 1:2.5
Invalidation du trade : Une clôture en 1H en dessous de 0.166 affaiblit la structure haussière.
📈 Analyse technique
Action des prix : Les plus hauts et les plus bas restent haussiers
Structure de marché : Poursuite haussière tant que le support ne casse pas.
Support : 0.170 – 0.166
Résistance : 0.177, puis 0.183
EMA/MA : Le prix reste au-dessus de MA7, MA25 et MA99, ce qui soutient les acheteurs.
Volume : Le rally a commencé avec une forte participation ; les bougies récentes montrent un volume plus léger, donc la confirmation est importante.
Liquidité : La liquidité côté acheteur se situe au-dessus de 0.1768 ; un balayage pourrait alimenter la continuation.
Order Block : Demande haussière autour de 0.166–0.170.
FVG : Petit déséquilibre sous le prix actuel susceptible d’être revisité avant la continuation.
SMC : Structure de marché haussière sans basculement baissier confirmé pour l’instant.
#AVA #AVAUSDT #AVAToken #AVACOIN #AVAcoinAdventure
⏰ Horizon : 1H (analysé uniquement à partir du graphique importé)
📊 Biais du marché : Haussier (prudemment haussier) Le prix évolue au-dessus des MM(7), MM(25) et MM(99), confirmant une structure haussière à court terme. La dynamique reste positive, mais le prix approche une résistance locale clé autour de 0.1768.
🎯 Configuration du trade
Trade : LONG (après confirmation)
Zone d’entrée : 0.170 – 0.173 (repli) ou après une cassure confirmée au-dessus de 0.177
Stop Loss : 0.166
TP1 : 0.177
TP2 : 0.183
TP3 : 0.190
Risque : Rendement : Environ 1:2.5
Invalidation du trade : Une clôture en 1H en dessous de 0.166 affaiblit la structure haussière.
📈 Analyse technique
Action des prix : Les plus hauts et les plus bas restent haussiers
Structure de marché : Poursuite haussière tant que le support ne casse pas.
Support : 0.170 – 0.166
Résistance : 0.177, puis 0.183
EMA/MA : Le prix reste au-dessus de MA7, MA25 et MA99, ce qui soutient les acheteurs.
Volume : Le rally a commencé avec une forte participation ; les bougies récentes montrent un volume plus léger, donc la confirmation est importante.
Liquidité : La liquidité côté acheteur se situe au-dessus de 0.1768 ; un balayage pourrait alimenter la continuation.
Order Block : Demande haussière autour de 0.166–0.170.
FVG : Petit déséquilibre sous le prix actuel susceptible d’être revisité avant la continuation.
SMC : Structure de marché haussière sans basculement baissier confirmé pour l’instant.
#AVA #AVAUSDT #AVAToken #AVACOIN #AVAcoinAdventure