

#zcashetfpostsfirstweeklyoutflow$93.6m
zcashetfpostsfirstweeklyoutflow$93.6m
Populaire
Récents


·
--
MISE À JOUR SUR L’ETF ZCASH
L’ETF de Zcash a enregistré sa première sortie nette hebdomadaire depuis son lancement en août.
Les investisseurs ont retiré 93,6 M$ alors que $ZEC baisse vers 1 300 $. Grayscale’s ZCSH avait attiré 98,2 M$ deux semaines plus tôt, mais aucun flux net d’achats quotidiens n’a été enregistré depuis le 22 septembre, selon SoSoValue.
Le ZEC se situait autour de 1 308 $ le 3 octobre, en baisse d’environ 17,5 % sur la semaine et d’environ 23 % par rapport à son récent pic à 1 690 $.
$ZEC
{future}(ZECUSDT)
MISE À JOUR SUR L’ETF ZCASH
L’ETF de Zcash a enregistré sa première sortie nette hebdomadaire depuis son lancement en août.
Les investisseurs ont retiré 93,6 M$ alors que $ZEC baisse vers 1 300 $. Grayscale’s ZCSH avait attiré 98,2 M$ deux semaines plus tôt, mais aucun flux net d’achats quotidiens n’a été enregistré depuis le 22 septembre, selon SoSoValue.
Le ZEC se situait autour de 1 308 $ le 3 octobre, en baisse d’environ 17,5 % sur la semaine et d’environ 23 % par rapport à son récent pic à 1 690 $.
$ZEC
L’ETF de Zcash a enregistré sa première sortie nette hebdomadaire depuis son lancement en août.
Les investisseurs ont retiré 93,6 M$ alors que $ZEC baisse vers 1 300 $. Grayscale’s ZCSH avait attiré 98,2 M$ deux semaines plus tôt, mais aucun flux net d’achats quotidiens n’a été enregistré depuis le 22 septembre, selon SoSoValue.
Le ZEC se situait autour de 1 308 $ le 3 octobre, en baisse d’environ 17,5 % sur la semaine et d’environ 23 % par rapport à son récent pic à 1 690 $.
$ZEC
133


Article
Voir la traduction
NVIDIA Hits Recording high up 2.4%#nvidiahitsrecordhighup2.4%
TLDR
NVDA set a new intraday record at $237.88 on 02/10/2026, while the official close was $233.95, up +1.34% from $230.86 The reported +2.4% refers to the session's peak advance: the stock gave back part of that gain before the closeThe move reflected broader AI/semicondoctor streangth and renewed investor focus on NVIDIA's AI-infrastructure demand, but next-session follow-through matters more than a single intraday high.
NVIDIA record-high update
As of the U.S. market close on 2026-10-02, NVIDIA (NVDA) reached a new intraday all-time high of $237.88. It finished at $233.95, a +$3.09 / +1.34% gain versus the prior close of $230.86. NVIDIA’s official investor-relations data confirms the new 52-week high.
Session Statistics
Date --------------------------------------02/10/2026
Previous Close -----------------------------$230.86
Open -------------------------------------- $236.06
Intraday high/record high --------------------$237.88
Intraday Low -------------------------------- $233.60
Closing price -------------------------------- $233.95
Official close-to-close change -------------- +$3.09/+1.34%
Intraday range ------------------------------$4.28
Intraday range as % of close -----------------1.83%
Volume ----------------------------------- 134.9M shares
Approx market capitalization --------------- $5.64T
After Hours Indication reported ------------- $234.22, +0.12% after the close
The distinction is important:News reported that NVDA was up as much as 2.4% during the October 2 session, but the final closing return was +1.34%. That means the stock hit the record high early or mid-session and then saw profit-taking into the close.
Recent price performance
Using reported closing prices:
1 day: +1.34%, from $230.86 to $233.95.5 trading days: +2.22%.1 month: +2.41%.3 months: +20.08%.Year to date: +25.44%.1 year: +24.69%.Five years: +1,027.90%.
The recent pattern shows NVDA rebounding from $210.96 on 2026-09-14 to $233.95 on 2026-10-02, an increase of about +10.9% in roughly three weeks. The stock also advanced over five consecutive completed sessions from $225.07 on 2026-09-25 to $233.95 on 2026-10-02, though the path included normal day-to-day volatility.
What drove the record high?
Confirmed market context: Binance News attributed the move to ongoing strength in technology, AI-related equities, and semiconductor sentiment. NVDA’s record happened in a broader environment where investors continued to focus on demand for AI infrastructure.
Company-specific narrative: Reports around the session highlighted renewed positive analyst attention after meetings with NVIDIA management. The key theme was demand diversification beyond traditional hyperscalers, including frontier AI labs, alongside the company’s efforts to increase revenue generated per gigawatt of deployed AI infrastructure. This is a supportive narrative, but it is not proof that future revenue or the share price will follow a straight line.
Fundamental backdrop: NVIDIA’s previously reported fiscal Q2 2026 revenue was $46.7B, up +56% year over year, while Data Center revenue was $41.1B, also up +56% year over year. Blackwell Data Center revenue increased +17% sequentially. These are historical results, but they explain why the market remains highly focused on AI-capex durability.
Market-quality read
The record is constructive from a momentum perspective because it was accompanied by strong volume near 135M shares and came after a roughly +20% three-month advance. However, the close at $233.95 was $3.93 below the intraday high, indicating that some sellers emerged near the record level.
For the record breakout to gain stronger confirmation, the market would typically look for:
repeated closes near or above the prior record zone rather than only intraday peaks;continued strength across the broader semiconductor group;evidence that AI-infrastructure spending remains resilient in company updates and earnings;sustained trading activity rather than a one-session volume spike.
Key uncertainties remain AI-capex concentration, valuation sensitivity after a major multi-year rally, competitive developments, export-policy risks, and any macro shift that pushes yields higher and compresses technology valuations.
$NVDA $NVDAB $AAPL.US
#ZcashETFPostsFirstWeeklyOutflow$93.6M #GreekPoliceBustCryptoScamRingArrest17 #FedOctoberRateHikeOddsFallTo17% #BitcoinRejectedAt$87K
{alpha}(560xa9ee28c80f960b889dfbd1902055218cba016f75)
{stock_us}(NVDA.US)
{future}(NVDAUSDT)
[Click here for Post "FED Rate-Hike Expectations Ease"](https://app.binance.com/uni-qr/cpos/373333490155225?r=bubuyvnj&l=en&uco=cuthsvmhrnhukta6pswucq&uc=app_square_share_link&us=copylink)
NVIDIA Hits Recording high up 2.4%
#nvidiahitsrecordhighup2.4%
TLDR
NVDA set a new intraday record at $237.88 on 02/10/2026, while the official close was $233.95, up +1.34% from $230.86 The reported +2.4% refers to the session's peak advance: the stock gave back part of that gain before the closeThe move reflected broader AI/semicondoctor streangth and renewed investor focus on NVIDIA's AI-infrastructure demand, but next-session follow-through matters more than a single intraday high.
NVIDIA record-high update
As of the U.S. market close on 2026-10-02, NVIDIA (NVDA) reached a new intraday all-time high of $237.88. It finished at $233.95, a +$3.09 / +1.34% gain versus the prior close of $230.86. NVIDIA’s official investor-relations data confirms the new 52-week high.
Session Statistics
Date --------------------------------------02/10/2026
Previous Close -----------------------------$230.86
Open -------------------------------------- $236.06
Intraday high/record high --------------------$237.88
Intraday Low -------------------------------- $233.60
Closing price -------------------------------- $233.95
Official close-to-close change -------------- +$3.09/+1.34%
Intraday range ------------------------------$4.28
Intraday range as % of close -----------------1.83%
Volume ----------------------------------- 134.9M shares
Approx market capitalization --------------- $5.64T
After Hours Indication reported ------------- $234.22, +0.12% after the close
The distinction is important:News reported that NVDA was up as much as 2.4% during the October 2 session, but the final closing return was +1.34%. That means the stock hit the record high early or mid-session and then saw profit-taking into the close.
Recent price performance
Using reported closing prices:
1 day: +1.34%, from $230.86 to $233.95.5 trading days: +2.22%.1 month: +2.41%.3 months: +20.08%.Year to date: +25.44%.1 year: +24.69%.Five years: +1,027.90%.
The recent pattern shows NVDA rebounding from $210.96 on 2026-09-14 to $233.95 on 2026-10-02, an increase of about +10.9% in roughly three weeks. The stock also advanced over five consecutive completed sessions from $225.07 on 2026-09-25 to $233.95 on 2026-10-02, though the path included normal day-to-day volatility.
What drove the record high?
Confirmed market context: Binance News attributed the move to ongoing strength in technology, AI-related equities, and semiconductor sentiment. NVDA’s record happened in a broader environment where investors continued to focus on demand for AI infrastructure.
Company-specific narrative: Reports around the session highlighted renewed positive analyst attention after meetings with NVIDIA management. The key theme was demand diversification beyond traditional hyperscalers, including frontier AI labs, alongside the company’s efforts to increase revenue generated per gigawatt of deployed AI infrastructure. This is a supportive narrative, but it is not proof that future revenue or the share price will follow a straight line.
Fundamental backdrop: NVIDIA’s previously reported fiscal Q2 2026 revenue was $46.7B, up +56% year over year, while Data Center revenue was $41.1B, also up +56% year over year. Blackwell Data Center revenue increased +17% sequentially. These are historical results, but they explain why the market remains highly focused on AI-capex durability.
Market-quality read
The record is constructive from a momentum perspective because it was accompanied by strong volume near 135M shares and came after a roughly +20% three-month advance. However, the close at $233.95 was $3.93 below the intraday high, indicating that some sellers emerged near the record level.
For the record breakout to gain stronger confirmation, the market would typically look for:
repeated closes near or above the prior record zone rather than only intraday peaks;continued strength across the broader semiconductor group;evidence that AI-infrastructure spending remains resilient in company updates and earnings;sustained trading activity rather than a one-session volume spike.
Key uncertainties remain AI-capex concentration, valuation sensitivity after a major multi-year rally, competitive developments, export-policy risks, and any macro shift that pushes yields higher and compresses technology valuations.
$NVDA $NVDAB $AAPL.US
#ZcashETFPostsFirstWeeklyOutflow$93.6M #GreekPoliceBustCryptoScamRingArrest17 #FedOctoberRateHikeOddsFallTo17% #BitcoinRejectedAt$87K
Click here for Post "FED Rate-Hike Expectations Ease"
TLDR
NVDA set a new intraday record at $237.88 on 02/10/2026, while the official close was $233.95, up +1.34% from $230.86 The reported +2.4% refers to the session's peak advance: the stock gave back part of that gain before the closeThe move reflected broader AI/semicondoctor streangth and renewed investor focus on NVIDIA's AI-infrastructure demand, but next-session follow-through matters more than a single intraday high.
NVIDIA record-high update
As of the U.S. market close on 2026-10-02, NVIDIA (NVDA) reached a new intraday all-time high of $237.88. It finished at $233.95, a +$3.09 / +1.34% gain versus the prior close of $230.86. NVIDIA’s official investor-relations data confirms the new 52-week high.
Session Statistics
Date --------------------------------------02/10/2026
Previous Close -----------------------------$230.86
Open -------------------------------------- $236.06
Intraday high/record high --------------------$237.88
Intraday Low -------------------------------- $233.60
Closing price -------------------------------- $233.95
Official close-to-close change -------------- +$3.09/+1.34%
Intraday range ------------------------------$4.28
Intraday range as % of close -----------------1.83%
Volume ----------------------------------- 134.9M shares
Approx market capitalization --------------- $5.64T
After Hours Indication reported ------------- $234.22, +0.12% after the close
The distinction is important:News reported that NVDA was up as much as 2.4% during the October 2 session, but the final closing return was +1.34%. That means the stock hit the record high early or mid-session and then saw profit-taking into the close.
Recent price performance
Using reported closing prices:
1 day: +1.34%, from $230.86 to $233.95.5 trading days: +2.22%.1 month: +2.41%.3 months: +20.08%.Year to date: +25.44%.1 year: +24.69%.Five years: +1,027.90%.
The recent pattern shows NVDA rebounding from $210.96 on 2026-09-14 to $233.95 on 2026-10-02, an increase of about +10.9% in roughly three weeks. The stock also advanced over five consecutive completed sessions from $225.07 on 2026-09-25 to $233.95 on 2026-10-02, though the path included normal day-to-day volatility.
What drove the record high?
Confirmed market context: Binance News attributed the move to ongoing strength in technology, AI-related equities, and semiconductor sentiment. NVDA’s record happened in a broader environment where investors continued to focus on demand for AI infrastructure.
Company-specific narrative: Reports around the session highlighted renewed positive analyst attention after meetings with NVIDIA management. The key theme was demand diversification beyond traditional hyperscalers, including frontier AI labs, alongside the company’s efforts to increase revenue generated per gigawatt of deployed AI infrastructure. This is a supportive narrative, but it is not proof that future revenue or the share price will follow a straight line.
Fundamental backdrop: NVIDIA’s previously reported fiscal Q2 2026 revenue was $46.7B, up +56% year over year, while Data Center revenue was $41.1B, also up +56% year over year. Blackwell Data Center revenue increased +17% sequentially. These are historical results, but they explain why the market remains highly focused on AI-capex durability.
Market-quality read
The record is constructive from a momentum perspective because it was accompanied by strong volume near 135M shares and came after a roughly +20% three-month advance. However, the close at $233.95 was $3.93 below the intraday high, indicating that some sellers emerged near the record level.
For the record breakout to gain stronger confirmation, the market would typically look for:
repeated closes near or above the prior record zone rather than only intraday peaks;continued strength across the broader semiconductor group;evidence that AI-infrastructure spending remains resilient in company updates and earnings;sustained trading activity rather than a one-session volume spike.
Key uncertainties remain AI-capex concentration, valuation sensitivity after a major multi-year rally, competitive developments, export-policy risks, and any macro shift that pushes yields higher and compresses technology valuations.
$NVDA $NVDAB $AAPL.US
#ZcashETFPostsFirstWeeklyOutflow$93.6M #GreekPoliceBustCryptoScamRingArrest17 #FedOctoberRateHikeOddsFallTo17% #BitcoinRejectedAt$87K
Click here for Post "FED Rate-Hike Expectations Ease"
2
12

·
--
#fedoctoberratehikeoddsfallto17%
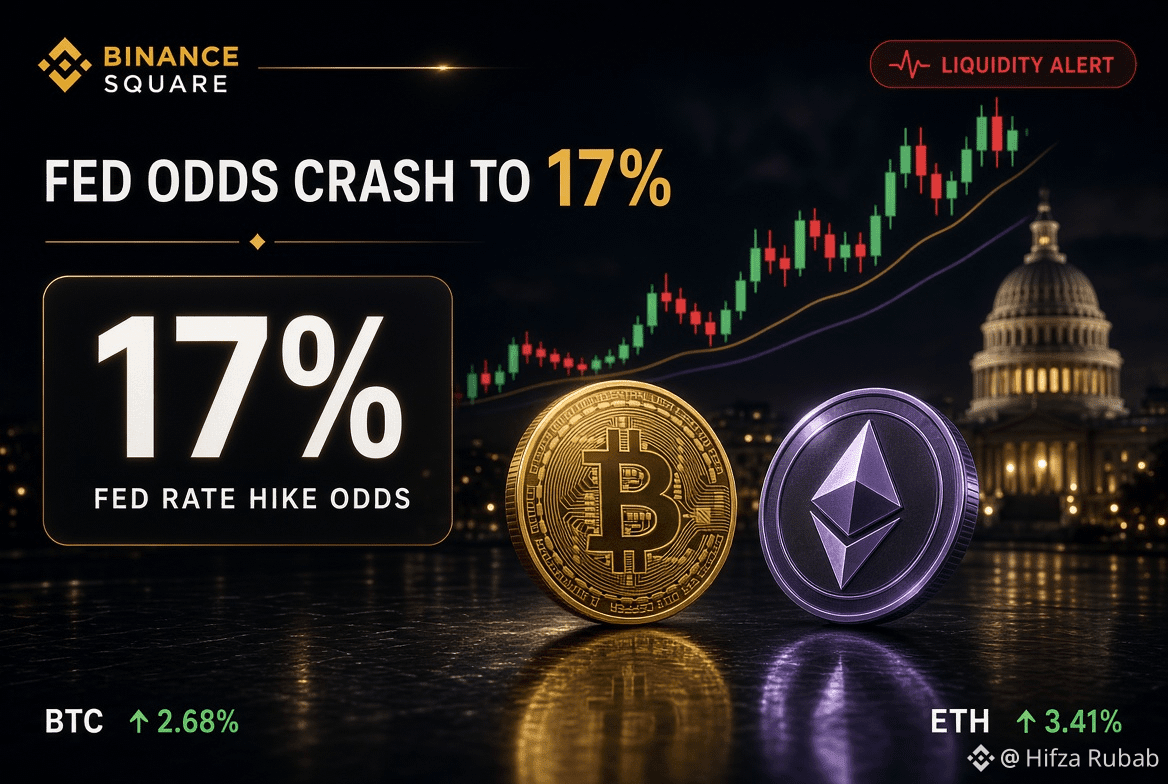
🚨 ALERTE DE LIQUIDITÉ : LES CHANCES DE HAUSSE DU TAUX DIRECTEUR DE LA FED TOMBE À 17 % ! 📊⚡
Un faible rapport sur l’emploi aux États-Unis a fait chuter les probabilités de hausse des taux de la Fed en octobre de 75 % à 17 % !
L’assouplissement des attentes de politique monétaire fait baisser les rendements et libère de la liquidité de marché, créant un puissant catalyseur macro pour les actifs à risque en crypto ! 🚀🔥
💡 À RETENIR POUR LES TRADERS :
Moins de hausses de taux = une liquidité mondiale en expansion → de forts afflux dans la crypto ! Cependant, un marché de l’emploi qui se refroidit signifie qu’il faut surveiller les données économiques de près avant de prendre un levier important ! 📈⚠️
🔍 2 MONNAIES MACRO À SURVEILLER :
🌐 $BTC (Bitcoin) — L’éponge de liquidité principale, qui mène le mouvement sur le marché alors que les vents contraires macro faiblissent ! 💎⚡
🔹 $ETH (Ethereum) — Actif de smart contracts de premier plan, prêt à accueillir une rotation massive de capitaux lorsque l’appétit pour le risque s’étend ! 🚀📊
Ce changement de liquidité propulsera-t-il Bitcoin vers un nouveau sommet ? Donnez vos objectifs ci-dessous ! 👇✨
#FedOctoberRateHikeOddsFallTo17%
#BitcoinRejectedAt$87K
#ZcashETFPostsFirstWeeklyOutflow$93.6M
#GreekPoliceBustCryptoScamRingArrest17
{spot}(ETHUSDT)
{spot}(BTCUSDT)
#fedoctoberratehikeoddsfallto17%
🚨 ALERTE DE LIQUIDITÉ : LES CHANCES DE HAUSSE DU TAUX DIRECTEUR DE LA FED TOMBE À 17 % ! 📊⚡
Un faible rapport sur l’emploi aux États-Unis a fait chuter les probabilités de hausse des taux de la Fed en octobre de 75 % à 17 % !
L’assouplissement des attentes de politique monétaire fait baisser les rendements et libère de la liquidité de marché, créant un puissant catalyseur macro pour les actifs à risque en crypto ! 🚀🔥
💡 À RETENIR POUR LES TRADERS :
Moins de hausses de taux = une liquidité mondiale en expansion → de forts afflux dans la crypto ! Cependant, un marché de l’emploi qui se refroidit signifie qu’il faut surveiller les données économiques de près avant de prendre un levier important ! 📈⚠️
🔍 2 MONNAIES MACRO À SURVEILLER :
🌐 $BTC (Bitcoin) — L’éponge de liquidité principale, qui mène le mouvement sur le marché alors que les vents contraires macro faiblissent ! 💎⚡
🔹 $ETH (Ethereum) — Actif de smart contracts de premier plan, prêt à accueillir une rotation massive de capitaux lorsque l’appétit pour le risque s’étend ! 🚀📊
Ce changement de liquidité propulsera-t-il Bitcoin vers un nouveau sommet ? Donnez vos objectifs ci-dessous ! 👇✨
#FedOctoberRateHikeOddsFallTo17%
#BitcoinRejectedAt$87K
#ZcashETFPostsFirstWeeklyOutflow$93.6M
#GreekPoliceBustCryptoScamRingArrest17
🚨 ALERTE DE LIQUIDITÉ : LES CHANCES DE HAUSSE DU TAUX DIRECTEUR DE LA FED TOMBE À 17 % ! 📊⚡
Un faible rapport sur l’emploi aux États-Unis a fait chuter les probabilités de hausse des taux de la Fed en octobre de 75 % à 17 % !
L’assouplissement des attentes de politique monétaire fait baisser les rendements et libère de la liquidité de marché, créant un puissant catalyseur macro pour les actifs à risque en crypto ! 🚀🔥
💡 À RETENIR POUR LES TRADERS :
Moins de hausses de taux = une liquidité mondiale en expansion → de forts afflux dans la crypto ! Cependant, un marché de l’emploi qui se refroidit signifie qu’il faut surveiller les données économiques de près avant de prendre un levier important ! 📈⚠️
🔍 2 MONNAIES MACRO À SURVEILLER :
🌐 $BTC (Bitcoin) — L’éponge de liquidité principale, qui mène le mouvement sur le marché alors que les vents contraires macro faiblissent ! 💎⚡
🔹 $ETH (Ethereum) — Actif de smart contracts de premier plan, prêt à accueillir une rotation massive de capitaux lorsque l’appétit pour le risque s’étend ! 🚀📊
Ce changement de liquidité propulsera-t-il Bitcoin vers un nouveau sommet ? Donnez vos objectifs ci-dessous ! 👇✨
#FedOctoberRateHikeOddsFallTo17%
#BitcoinRejectedAt$87K
#ZcashETFPostsFirstWeeklyOutflow$93.6M
#GreekPoliceBustCryptoScamRingArrest17
1
69

·
--
Le Bitcoin traverse-t-il une phase d’accumulation ou une fausse accumulation ? 🧠📉Malgré les fluctuations récentes du prix observées sur le marché, de nombreux analystes estiment que le mouvement actuel du Bitcoin ressemble à une phase d’accumulation (Accumulation) avant la prochaine impulsion.
Voici 3 points clés à surveiller actuellement :
1️⃣ Niveaux de support et de résistance : le maintien des niveaux de support principaux donne un signal positif indiquant la poursuite de l’élan haussier.
Le Bitcoin traverse-t-il une phase d’accumulation ou une fausse accumulation ? 🧠📉
Malgré les fluctuations récentes du prix observées sur le marché, de nombreux analystes estiment que le mouvement actuel du Bitcoin ressemble à une phase d’accumulation (Accumulation) avant la prochaine impulsion.
Voici 3 points clés à surveiller actuellement :
1️⃣ Niveaux de support et de résistance : le maintien des niveaux de support principaux donne un signal positif indiquant la poursuite de l’élan haussier.
Voici 3 points clés à surveiller actuellement :
1️⃣ Niveaux de support et de résistance : le maintien des niveaux de support principaux donne un signal positif indiquant la poursuite de l’élan haussier.
30

·
--
Super ($SUPER) a progressé de 6,04 % avec une position sur la plage haute de 88,8 % et une volatilité modérée. Worldcoin ($WLD) a bondi de 10,56 %, avec un volume de 93,6 M, un élan de 22,3, une volatilité de 18,6 et un risque de retournement de 19,2. Injective ($INJ) a gagné 2,25 %, avec un faible élan et une faible volatilité. Le scénario le plus solide est $WLD : rendement élevé, volume élevé, élan fort. Surveillez si le prix reste au-dessus de 0,5901 ; risque de retournement si l’élan ralentit.
Super ($SUPER ) a progressé de 6,04 % avec une position sur la plage haute de 88,8 % et une volatilité modérée. Worldcoin ($WLD ) a bondi de 10,56 %, avec un volume de 93,6 M, un élan de 22,3, une volatilité de 18,6 et un risque de retournement de 19,2. Injective ($INJ ) a gagné 2,25 %, avec un faible élan et une faible volatilité. Le scénario le plus solide est $WLD : rendement élevé, volume élevé, élan fort. Surveillez si le prix reste au-dessus de 0,5901 ; risque de retournement si l’élan ralentit.
75

·
--
Où vous situez-vous sur $ETH ?
Bullish
Bearish
Une baleine a ouvert un long de 93,6 M$.
BlackRock et d’autres ETF ont vendu pour 59,58 M$ de ETH.
Commentez votre choix : bullish ou bearish.
Ce n’est pas un conseil financier. Faites vos propres recherches (DYOR).
Où vous situez-vous sur $ETH ?
Bullish
Bearish
Une baleine a ouvert un long de 93,6 M$.
BlackRock et d’autres ETF ont vendu pour 59,58 M$ de ETH.
Commentez votre choix : bullish ou bearish.
Ce n’est pas un conseil financier. Faites vos propres recherches (DYOR).
Bullish
Bearish
Une baleine a ouvert un long de 93,6 M$.
BlackRock et d’autres ETF ont vendu pour 59,58 M$ de ETH.
Commentez votre choix : bullish ou bearish.
Ce n’est pas un conseil financier. Faites vos propres recherches (DYOR).

55

URGENT :
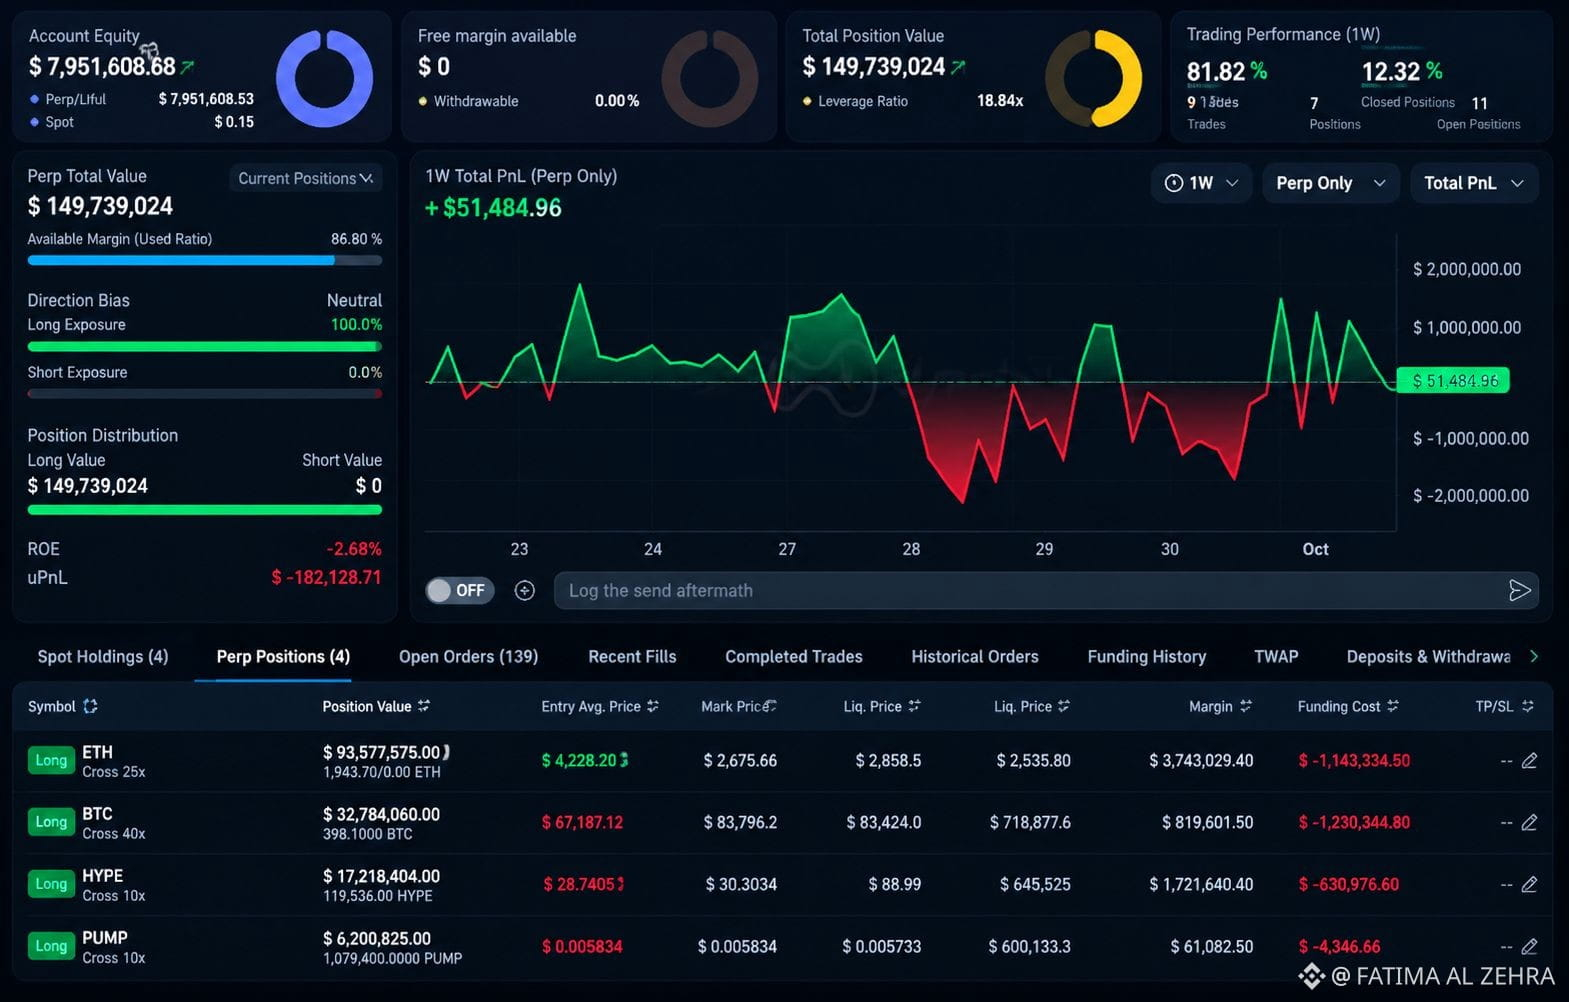
Une baleine avec un taux de victoire de 100 % a ouvert un long de 93,6 M$ en $ETH, un long de 32,8 M$ en $BTC, un long de 17,2 M$ en $HYPE et un long de 6,2 M$ en $PUMP.
🦥🦥#MetaMaskExitsLidoValidatorsAfterSecurityIncident
URGENT :
Une baleine avec un taux de victoire de 100 % a ouvert un long de 93,6 M$ en $ETH, un long de 32,8 M$ en $BTC, un long de 17,2 M$ en $HYPE et un long de 6,2 M$ en $PUMP.
🦥🦥#MetaMaskExitsLidoValidatorsAfterSecurityIncident
Une baleine avec un taux de victoire de 100 % a ouvert un long de 93,6 M$ en $ETH, un long de 32,8 M$ en $BTC, un long de 17,2 M$ en $HYPE et un long de 6,2 M$ en $PUMP.
🦥🦥#MetaMaskExitsLidoValidatorsAfterSecurityIncident
AngelOfCrypto_-:
nice
1
1
297

·
--
🚨 UNE GROSSE BALEINE DE 150M$+ VIENT D’ENTRER MASSIVEMENT EN LONG. 👀
Alors que le marché crypto est rempli de peur et d’incertitude, une seule baleine miserait GROS sur un rebond.
🐋 93,6M$ ETH LONG
₿ 32,8M$ BTC LONG
🔥 17,2M$ HYPE LONG
🚀 6,2M$ PUMP LONG
Soit environ 150M$+ d’exposition en long. 🤯
Et la plus grande question est :
QU’EST-CE QUE CETTE BALEINE VOIT, QUE LE RESTE DU MARCHÉ NE VOIT PAS ? 👀
C’est un placement intelligent pour un rebond… ou un pari massif avec effet de levier ?
SIGNAL BULLISH OU PIÈGE ? 🐋📈📉
#Bitcoin #Ethereum #Crypto #Trading #CryptoMarket $BTC $ETH $MOVR
🚨 UNE GROSSE BALEINE DE 150M$+ VIENT D’ENTRER MASSIVEMENT EN LONG. 👀
Alors que le marché crypto est rempli de peur et d’incertitude, une seule baleine miserait GROS sur un rebond.
🐋 93,6M$ ETH LONG
₿ 32,8M$ BTC LONG
🔥 17,2M$ HYPE LONG
🚀 6,2M$ PUMP LONG
Soit environ 150M$+ d’exposition en long. 🤯
Et la plus grande question est :
QU’EST-CE QUE CETTE BALEINE VOIT, QUE LE RESTE DU MARCHÉ NE VOIT PAS ? 👀
C’est un placement intelligent pour un rebond… ou un pari massif avec effet de levier ?
SIGNAL BULLISH OU PIÈGE ? 🐋📈📉
#Bitcoin #Ethereum #Crypto #Trading #CryptoMarket $BTC $ETH $MOVR
Alors que le marché crypto est rempli de peur et d’incertitude, une seule baleine miserait GROS sur un rebond.
🐋 93,6M$ ETH LONG
₿ 32,8M$ BTC LONG
🔥 17,2M$ HYPE LONG
🚀 6,2M$ PUMP LONG
Soit environ 150M$+ d’exposition en long. 🤯
Et la plus grande question est :
QU’EST-CE QUE CETTE BALEINE VOIT, QUE LE RESTE DU MARCHÉ NE VOIT PAS ? 👀
C’est un placement intelligent pour un rebond… ou un pari massif avec effet de levier ?
SIGNAL BULLISH OU PIÈGE ? 🐋📈📉
#Bitcoin #Ethereum #Crypto #Trading #CryptoMarket $BTC $ETH $MOVR
209

·
--
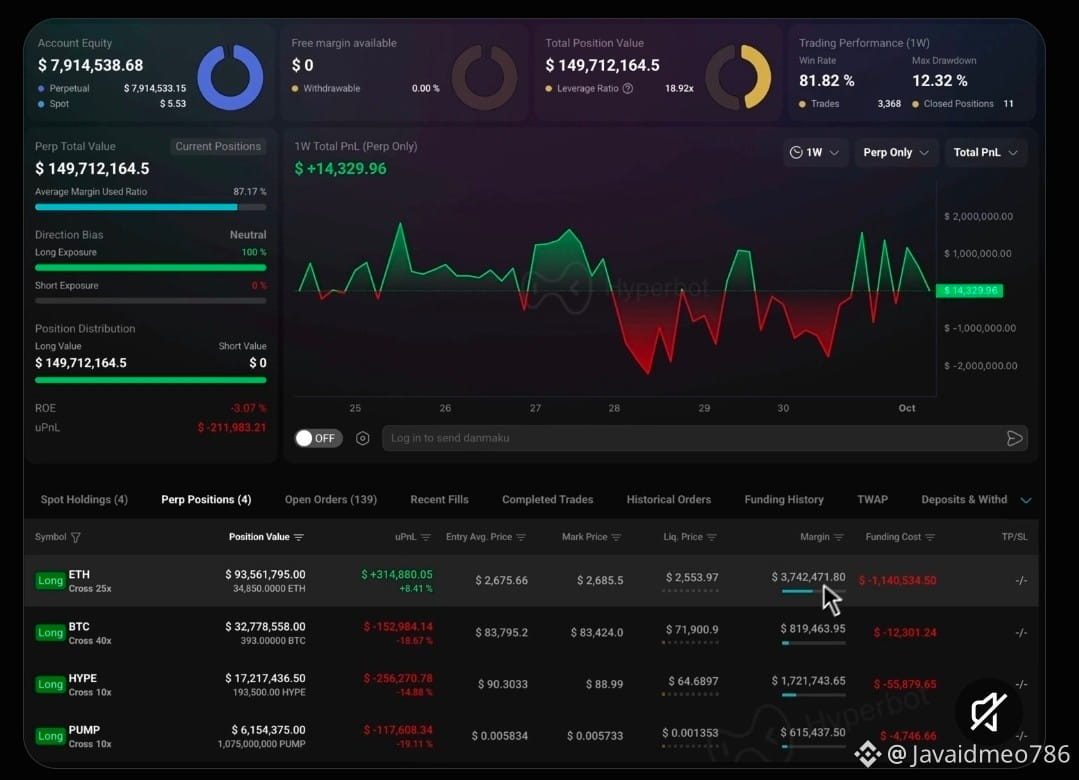
Une baleine avec un taux de victoire de 100% a ouvert un long de 93,6M $ $ETH , un long de 32,8M $ $BTC, un long de 17,2M $HOT et un long de 6,2M $ $PUMP.
Sait-elle quelque chose ?
Une baleine avec un taux de victoire de 100% a ouvert un long de 93,6M $ $ETH , un long de 32,8M $ $BTC, un long de 17,2M $HOT et un long de 6,2M $ $PUMP.
Sait-elle quelque chose ?
Sait-elle quelque chose ?
209
Connectez-vous pour découvrir plus de contenu
Rejoignez la communauté mondiale des adeptes de cryptomonnaies sur Binance Square
⚡️ Suviez les dernières informations importantes sur les cryptomonnaies.
💬 Jugé digne de confiance par la plus grande plateforme d’échange de cryptomonnaies au monde.
👍 Découvrez les connaissances que partagent les créateurs vérifiés.
Adresse e-mail/Nº de téléphone
Sujets d’actualité
1
#ZcashETFPostsFirstWeeklyOutflow$93.6M
35 vues
15 mentions
2
#GreekPoliceBustCryptoScamRingArrest17
103 vues
27 mentions
3
#BitcoinRejectedAt$87K
46,633 vues
83 mentions
4
#FedOctoberRateHikeOddsFallTo17%
26,947 vues
435 mentions
5
#NvidiaHitsRecordHighUp2.4%
10,258 vues
285 mentions
6
#CanaryFilesAmendedS1ForPEPEETF
5,308 vues
206 mentions
7
#USRussiaUkraineTalksReportedlyIncludeLukoilOilDeal
14,727 vues
281 mentions
8
#BitcoinParesGainsAfterRallyTo$86.5K
39,227 vues
150 mentions
9
#CerebrasSinksNearly20%OnReportNvidiaToPowerOpenAI
87,449 vues
854 mentions
10
#SECProposesCryptoCustodyRules
113,139 vues
1,063 mentions