

#latestanalysis
latestanalysis
324 vues
15 mentions
Populaire
Récents

*Analyse récente de Bitcoin - 6 août 2026* 📊
$BTC
*Prix actuel*: 64 771,38 $, en hausse de 0,42 % sur la journée
*Fourchette sur 24 h*: 64 172 - 65 025 f722
*Points clés:*
1. *Toujours dans une tendance baissière*: Le BTC est en baisse de plus de 20 % en 2026. Il est passé sous 60 000 $ en juin et reste loin du sommet à 120 000 $ atteint fin de l’année dernière.
2. *Vents contraires*:
- *Brèche de sécurité*: 89 M$ ont été retirés de 1 196 portefeuilles à cause d’une erreur dans le code du wallet Coldcard
- *Vente institutionnelle*: Strategy a vendu 1 638 BTC pour 104,73 M$ entre le 27 juillet et le 2 août. Leur prix d’achat moyen est de 75 419 $.
- *Sorties de flux des ETF*: 4 Md$+ se sont précipités hors des ETF spot Bitcoin depuis le 15 mai
3. *Soutien à court terme*: Les analystes voient un support clé entre 63 500 $ et 63 800 $. Un rebond vers 68 000 $ est possible dans les 1 à 2 prochaines semaines, avec 75 000 $ à 80 000 $ si l’élan se renforce.
4. *Risque*: L’analyse des vagues d’Elliott suggère un dernier creux vers 55 500 $ - 56 000 $ avant un rebond en juillet. Le mois d’août est historiquement baissier. 96dae3652b481439dafa
*Conclusion*: Le BTC consolide près de 64 K$ avec une résistance à 67 000 $+. Le sentiment du marché est faible en raison des tensions géopolitiques et de la pression de vente. 143996da3f13
---
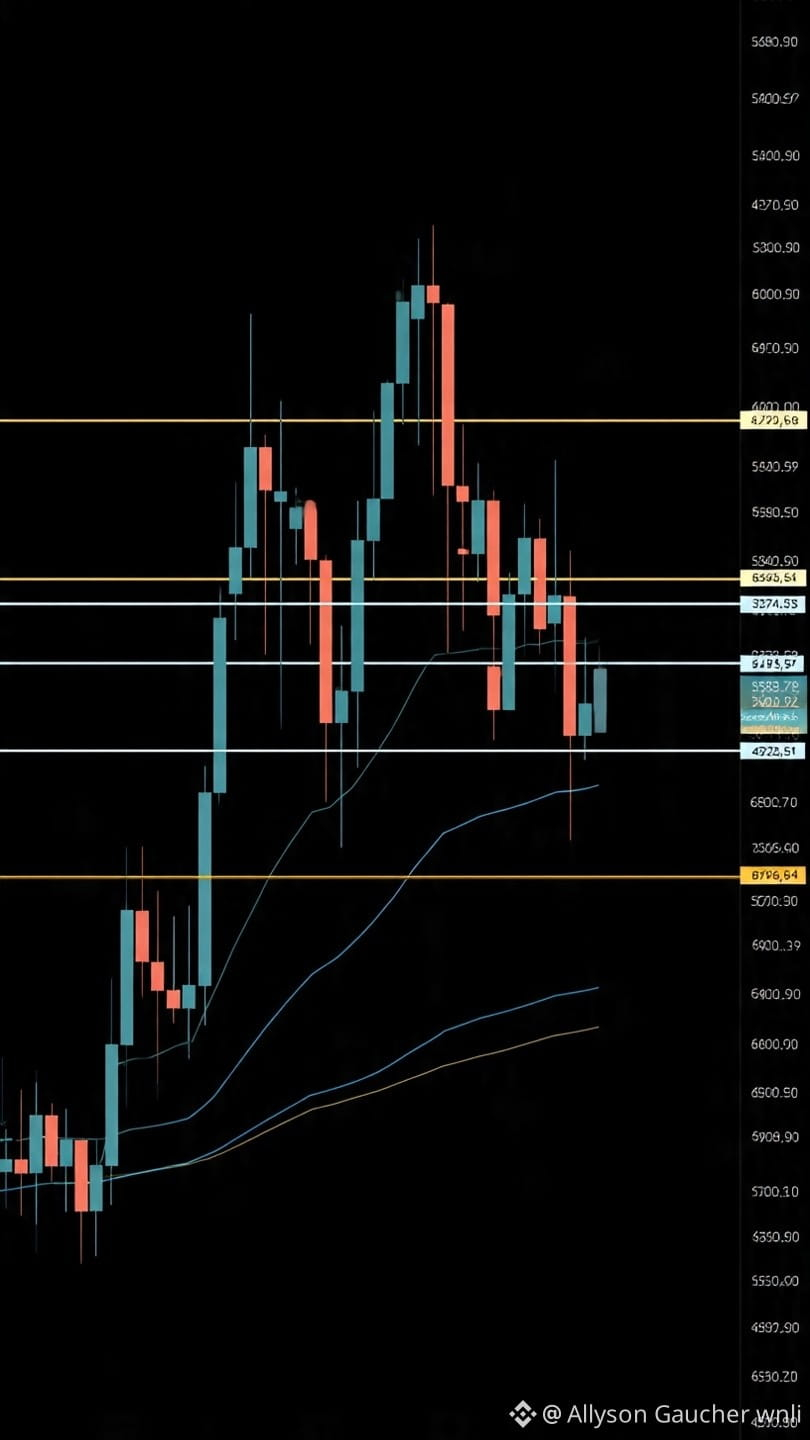
Voici une visualisation rapide de l’évolution du prix du BTC cette semaine :

Souhaitez-vous que je crée un graphique plus détaillé avec les niveaux de support/résistance à 63,5 K$ et 67 K$ indiqués ?
#$BTC #LatestAnalysis #HYPEGains79%InQ2 $BTC
*Analyse récente de Bitcoin - 6 août 2026* 📊
$BTC
*Prix actuel*: 64 771,38 $, en hausse de 0,42 % sur la journée
*Fourchette sur 24 h*: 64 172 - 65 025 f722
*Points clés:*
1. *Toujours dans une tendance baissière*: Le BTC est en baisse de plus de 20 % en 2026. Il est passé sous 60 000 $ en juin et reste loin du sommet à 120 000 $ atteint fin de l’année dernière.
2. *Vents contraires*:
- *Brèche de sécurité*: 89 M$ ont été retirés de 1 196 portefeuilles à cause d’une erreur dans le code du wallet Coldcard
- *Vente institutionnelle*: Strategy a vendu 1 638 BTC pour 104,73 M$ entre le 27 juillet et le 2 août. Leur prix d’achat moyen est de 75 419 $.
- *Sorties de flux des ETF*: 4 Md$+ se sont précipités hors des ETF spot Bitcoin depuis le 15 mai
3. *Soutien à court terme*: Les analystes voient un support clé entre 63 500 $ et 63 800 $. Un rebond vers 68 000 $ est possible dans les 1 à 2 prochaines semaines, avec 75 000 $ à 80 000 $ si l’élan se renforce.
4. *Risque*: L’analyse des vagues d’Elliott suggère un dernier creux vers 55 500 $ - 56 000 $ avant un rebond en juillet. Le mois d’août est historiquement baissier. 96dae3652b481439dafa
*Conclusion*: Le BTC consolide près de 64 K$ avec une résistance à 67 000 $+. Le sentiment du marché est faible en raison des tensions géopolitiques et de la pression de vente. 143996da3f13
---
Voici une visualisation rapide de l’évolution du prix du BTC cette semaine :

Souhaitez-vous que je crée un graphique plus détaillé avec les niveaux de support/résistance à 63,5 K$ et 67 K$ indiqués ?
#$BTC #LatestAnalysis #HYPEGains79%InQ2 $BTC
$BTC
*Prix actuel*: 64 771,38 $, en hausse de 0,42 % sur la journée
*Fourchette sur 24 h*: 64 172 - 65 025 f722
*Points clés:*
1. *Toujours dans une tendance baissière*: Le BTC est en baisse de plus de 20 % en 2026. Il est passé sous 60 000 $ en juin et reste loin du sommet à 120 000 $ atteint fin de l’année dernière.
2. *Vents contraires*:
- *Brèche de sécurité*: 89 M$ ont été retirés de 1 196 portefeuilles à cause d’une erreur dans le code du wallet Coldcard
- *Vente institutionnelle*: Strategy a vendu 1 638 BTC pour 104,73 M$ entre le 27 juillet et le 2 août. Leur prix d’achat moyen est de 75 419 $.
- *Sorties de flux des ETF*: 4 Md$+ se sont précipités hors des ETF spot Bitcoin depuis le 15 mai
3. *Soutien à court terme*: Les analystes voient un support clé entre 63 500 $ et 63 800 $. Un rebond vers 68 000 $ est possible dans les 1 à 2 prochaines semaines, avec 75 000 $ à 80 000 $ si l’élan se renforce.
4. *Risque*: L’analyse des vagues d’Elliott suggère un dernier creux vers 55 500 $ - 56 000 $ avant un rebond en juillet. Le mois d’août est historiquement baissier. 96dae3652b481439dafa
*Conclusion*: Le BTC consolide près de 64 K$ avec une résistance à 67 000 $+. Le sentiment du marché est faible en raison des tensions géopolitiques et de la pression de vente. 143996da3f13
---
Voici une visualisation rapide de l’évolution du prix du BTC cette semaine :

Souhaitez-vous que je crée un graphique plus détaillé avec les niveaux de support/résistance à 63,5 K$ et 67 K$ indiqués ?
#$BTC #LatestAnalysis #HYPEGains79%InQ2 $BTC
115

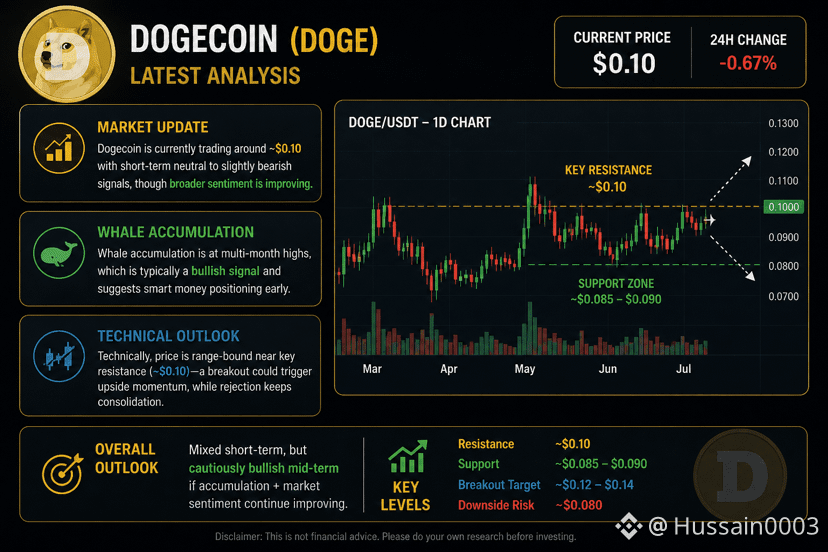
$DOGE se trade actuellement autour de ~$0,10 avec des signaux neutres à légèrement baissiers à court terme, bien que le sentiment général s'améliore.
L'accumulation des baleines est à des sommets de plusieurs mois, ce qui est typiquement un signal haussier et suggère que les gros investisseurs se positionnent tôt.
Techniquement, le prix est en range près de la résistance clé (~$0,10)—un breakout pourrait déclencher un momentum haussier, tandis qu'un rejet maintient la consolidation.
#EthereumFoundationSellsETHtoBitmineAgain #U.S.SenatorsBarredfromTradingonPredictionMarkets ##BankofEnglandMayPauseDigitalPound #DOGE #LatestAnalysis
{spot}(DOGEUSDT)
$DOGE se trade actuellement autour de ~$0,10 avec des signaux neutres à légèrement baissiers à court terme, bien que le sentiment général s'améliore.
L'accumulation des baleines est à des sommets de plusieurs mois, ce qui est typiquement un signal haussier et suggère que les gros investisseurs se positionnent tôt.
Techniquement, le prix est en range près de la résistance clé (~$0,10)—un breakout pourrait déclencher un momentum haussier, tandis qu'un rejet maintient la consolidation.
#EthereumFoundationSellsETHtoBitmineAgain #U.S.SenatorsBarredfromTradingonPredictionMarkets ##BankofEnglandMayPauseDigitalPound #DOGE #LatestAnalysis
L'accumulation des baleines est à des sommets de plusieurs mois, ce qui est typiquement un signal haussier et suggère que les gros investisseurs se positionnent tôt.
Techniquement, le prix est en range près de la résistance clé (~$0,10)—un breakout pourrait déclencher un momentum haussier, tandis qu'un rejet maintient la consolidation.
#EthereumFoundationSellsETHtoBitmineAgain #U.S.SenatorsBarredfromTradingonPredictionMarkets ##BankofEnglandMayPauseDigitalPound #DOGE #LatestAnalysis
90
Connectez-vous pour découvrir plus de contenu
Rejoignez la communauté mondiale des adeptes de cryptomonnaies sur Binance Square
⚡️ Suviez les dernières informations importantes sur les cryptomonnaies.
💬 Jugé digne de confiance par la plus grande plateforme d’échange de cryptomonnaies au monde.
👍 Découvrez les connaissances que partagent les créateurs vérifiés.
Adresse e-mail/Nº de téléphone
Sujets d’actualité
1
#NFPWatch
10.8M vues
19,210 mentions
2
#BitcoinFundingRateTriplesTo10%
160,358 vues
1,152 mentions
3
#BitcoinSurpasses$86KUp2.99%
51,993 vues
113 mentions
4
#ZcashFalls21%FromSeptemberPeak
86,035 vues
829 mentions
5
#USSeptemberPayrollsAdd29KUnemploymentRises4.2%
70,830 vues
509 mentions
6
#XRPPostsFirstThreeGreenMonthsInQ3
58,319 vues
688 mentions
7
#BNBChainTokenizedStocksTop$1BAt30%Share
26,526 vues
38 mentions
8
#BitcoinRisesToward$85K
122,480 vues
157 mentions
9
#AmazonPlansToSell$8BNvidiaChips
8,018 vues
91 mentions
10
#NEARFallsToAround$4.70Down14%
49,809 vues
118 mentions