


Sam joe
Ouvert au trading
Trade occasionnellement
1.6 an(s)
195 Suivis
67 Abonnés
159 J’aime
Publications
Portefeuille
Tous
Citations

SoverignLedger
·
--
Tesla & Meta Earnings Preview – The Real Numbers Behind the Hype
#earningsseason
Tesla & Meta Earnings Preview – The Real Numbers Behind the Hype
Both report after close today. Big stage for the Mag 7, but let’s cut the noise and look at what actually matters.
Tesla first – the flying Roadster question
Yes, the new Roadster can hop, flip, and look like something out of a sci-fi movie with those cold-gas thrusters. Cool demo. Production starts 2028. Analysts (Morningstar, others) are talking roughly 2,000 units a year at peak. Even if you stretch the average selling price to $220k–$300k, you’re looking at maybe $500–600 million in annual revenue(high-end variants like the Thrust and Rocket packages require reservation).
Tesla’s automotive revenue alone is running ~$70 billion a year range. That Roadster number is less than 1%. It’s a halo product. Brand flex. Engineering statement. It will not move the generate earnings this year, next year, or may be after year. Musk himself has called similar projects “small potato” in the past.
What will move the needle today is the actual Q3 print:
- Deliveries already reported: 486,532 (beat the ~462k consensus by a solid 5%+)
- Revenue expected around $28.0–28.3 billion (basically flat year-over-year)
- Non-GAAP EPS expected ~$0.43–0.45 (down from $0.50 last year)
- Energy storage was softer at 13.7 GWh (missed the higher hopes)
The stock is still down ~17% year-to-date. Trailing P/E is still north of 340x. Forward is “only” ~160–190x. That’s a lot of future perfection already priced in. Robotaxi fleet growth in Austin (300+ Cybercabs, 8x in a month) and FSD subscription numbers (1.48 million active) are the real story people will listen for on the call. Not the flying car.
My take on $ TSLA after the report: Cautiously bearish near-term if margins and free cash flow stay under pressure from the heavy >$25B capex plan. The long-term autonomy story is still the only reason the valuation makes any sense. Delivery beat is good, but it was already known. Need real progress language on robotaxi unit economics and Optimus. Even though thier is some spreded news that people around the world has pre-booked this Tesla's Car.
Meta side by side
Meta is in a different spot. Stock has been stronger on the back of Muse. The AI agent hit 10 million+ US downloads in about 40 days. Early retention and usage numbers look better than most expected. Analysts are calling it a potential game-changer for monetizing the 3.5 billion user base.
Consensus for Q3:
- Revenue ~$63.3–63.4 billion (up ~23–24% year-over-year)
- EPS estimates all over the place because of a big legal settlement charge (~$10B), but underlying ad business still looks solid
The real tension is the spending. Capex is expected to more than double, with full-year 2026 guidance still in the $130–145 billion range. Free cash flow is getting squeezed. Muse is the bet that this spending eventually pays off through subscriptions + better ad targeting + transaction fees.
Bottom line for today
Flying Roadster = great content, zero near-term earnings impact. Tesla needs the call to show the autonomy path is getting clearer and cheaper. Meta needs to show Muse is converting users into real dollars while the ad engine keeps humming under heavy AI spend.
Both are high-stakes prints. One is priced for perfection on future tech. The other is trying to prove the current AI spend is justified. Numbers drop after the close. The market will tell us which story it believes more by tomorrow morning.
What’s your lean going into the reports? Share your views in comment section.
$TSLA $META $BTC
#JapanTransportMinisterToStudyStablecoinTaxRefunds #NEAROpensVoteToCutAnnualIssuanceTo1.6% #SixBlockchainGroupsAskSECToCodifyDigitalCommodityDefinition #AnthropicDraftS1ShowsH1LossOf$80.7B

SoverignLedger
·
--
Japan FSA Publishes Minutes of the “Forum on On-Chain Finance in the AI Era”
#japanfsapublishesonchainfinanceforumminutes
Japan FSA Publishes Minutes of the “Forum on On-Chain Finance in the AI Era” (First Meeting, 30 September 2026; Minutes Released 19 October 2026)
Prepared: 19 October 2026 | Source: Japan Financial Services Agency (FSA), official minutes and accompanying materials
1. Forum Architecture & Policy Stature
The forum is chaired by the Minister of State for Financial Services (Katayama) and convenes the Digital Agency, Ministry of Finance (MoF), Bank of Japan (BOJ), and Japanese Bankers Association (JBA) at director-general / executive-director level, alongside appointed private-sector experts (Brunswick Group, Nagoya University of Commerce & Business, University of Tokyo, PwC Japan, among others).
Structural signal: This is not a crypto-market consultation. It is a whole-of-government financial-infrastructure coordination body, with the Digital Agency (payments), MoF (debt management), BOJ (settlement finality), and JBA (interbank rails) all in the same room. The FSA’s own framing places on-chain finance within the “Growth Investment-Oriented Financial Strategy” approved in July 2026, explicitly linked to the coming era of AI agents conducting autonomous economic activity.
2. Key Initiatives — Disclosed Data & Commitments
2.1 Tokenized Japanese Government Bonds (JGBs)
The Ministry of Finance has already convened its first dedicated expert study group on JGB tokenization on 8 October 2026, less than two weeks after the forum meeting. The MoF paper sets out three distinct technical pathways, none of which is yet a settled decision:
| Pathway | Description | Systemic Depth |
|1. Beneficiary-rights tokenization | Rights of a money-market fund investing in JGBs are transferred on-chain; the bond itself is untouched. | Shallowest; fastest to pilot. |
| 2. On-chain book-entry settlement | Transfer ledgers of the existing JGB book-entry system are fixed on-chain — either at a single account-management institution, across coordinated institutions, or at the BOJ’s own ledger as central transfer agent. | Deep; touches core settlement plumbing. |
| 3. Native on-chain JGB issuance | A new form of government bond issued directly on a blockchain outside the existing settlement system. | Deepest; requires new legal and market infrastructure. |
Scale of the prize: Japan’s JGB repo market is estimated at ¥250–270 trillion (≈US$1.6 trillion), representing approximately 10% of the global government-bond-backed repo segment (≈US$16 trillion). The working group’s stated targets are T+0 same-day settlement, 24/7 availability, and simplified cross-border access.
Why the urgency is structural, not opportunistic: The 10-year JGB yield reached 2.95% in August 2026 — the highest since September 1996. The 2-year hit a 31-year high of 1.75%, and the 5-year set a record 2.21%. The last two 10-year auctions drew weak bids, indicating demand has plateaued among the traditional domestic buyer base.
Fiscal pressure quantified: Ministries requested a record ¥143 trillion (≈US$918 billion) for FY2027 — the fourth consecutive annual record. Debt-servicing costs are set to reach ¥36.64 trillion (≈US$234 billion), with the assumed interest rate raised from 3% to 3.8%. Japan carries the worst fiscal position among major advanced economies.
Interpretation: Tokenized JGBs are being positioned not as a crypto product, but as a new distribution and collateral channel for the world’s largest sovereign-debt stock, aimed at on-chain-native overseas investors who otherwise have no seamless way to park idle cash in JGBs.
2.2 Stablecoins & Programmable Public Subsidies
The Digital Agency (Hasui, Director-General for Strategy and Organisation) confirmed it will study, from a technical feasibility standpoint, whether stablecoins and tokenized deposits can be used to distribute public funds. The explicit design concept is programmability: restricting subsidy use to specific purposes such as child-rearing or food assistance, ensuring funds are used as intended.
Global stablecoin stock — the baseline disclosed at the forum: Total stablecoin issuance stands at ≈US$310 billion, of which 83% is USD-denominated. This figure is critical: it underscores that yen-denominated stablecoin infrastructure is severely under-represented relative to Japan’s share of global GDP and financial assets, a gap the public-sector initiatives are implicitly designed to close.
Domestic stablecoin momentum already visible:
- JPYC (first domestically regulated yen stablecoin) reached ¥3 billion cumulative issuance and ¥35 billion in total transaction volume within seven months of launch, after crossing ¥1.3 billion issuance by January 2026 (≈69% monthly growth at that stage).
- JPYC’s total transaction volume reached US$136 million, with over 60% (US$90 million) processed on Polygon.
- HashWallet monthly stablecoin settlement volume is ≈¥1 billion, growing >30% month-on-month, with 1.15 million users.
- Japan’s three megabanks (MUFG, SMBC, Mizuho) have completed a joint trial of stablecoin-based cross-border payments and are targeting a shared yen stablecoin for business payments by March 2027 (fiscal 2026 deadline).
Payments Innovation Project (PIP) pipeline: The FSA’s PIP had supported 4 cases as of 29 September 2026, the fourth being a TradeWaltz-led cross-border trade settlement stablecoin pilot — the 15th case overall under the FinTech Experiment Hub since 2017. A separate live tokenized-deposit interbank test involves 43 companies (3 applicants, 13 participating-bank entries, 21 observer entries).
2.3 BOJ DLT Sandbox for Central-Bank Settlement
The BOJ’s DLT Sandbox Project is testing whether BOJ current-account deposits — central-bank reserves — can be used for on-chain settlement. Governor Ueda’s March 2026 announcement framed the experiment as covering domestic interbank settlement and securities settlement, with the explicit aim of enabling instant, round-the-clock settlement and reducing gridlock risk in stress events.
Timeline (official):
| Milestone | Timing |
| Prototype development begins | Q2 2026 |
| Real-world testing with selected financial institutions | Through 2027 |
| Results expected | Early 2028 |
Parallel international track: Japan participates in Project Agorá, a multi-central-bank / private-institution experiment exploring tokenized wholesale central-bank deposits for cross-border payments. The BOJ has also signalled that a retail digital-yen decision is due in 2026, though the DLT sandbox is explicitly wholesale-focused — it is about the money banks hold at the central bank, not consumer cash.
2.4 JBA & Next-Generation Interbank Infrastructure
The Japanese Bankers Association has established a dedicated study group under its own auspices to discuss next-generation interbank settlement infrastructure, feeding into future proof-of-concept work and a phased roadmap. The JBA explicitly frames its role as preserving the “reliability, safety, and stability” of Japan’s deposit and payment systems while adapting them to on-chain rails.
Longer-horizon signal: The FSA, MoF, and BOJ are planning a national blockchain-based settlement system for stocks and government bonds, with work expected to begin by early 2027 and potential operations in the early 2030s.
3. Statistical & Market Analysis
3.1 Tokenized Real-World Assets (RWA) — Global Context
The global tokenized RWA market reached US$39.2 billion in October 2026, up from ≈US$21 billion at the start of the year — growth of ≈87% in under 10 months.
Japan’s position within that market: Cumulative tokenized securities issuance in Japan is reported at JPY 333–360 billion (≈US$2.1–2.25 billion), but this is concentrated in real-estate products, not sovereign debt. The JGB tokenization initiative therefore represents a step-change in asset class and systemic scale: from a ~US$2bn base dominated by property to a potential claim on a US$1.6 trillion repo market.
3.2 JGB Yield Curve — The Demand Problem in Numbers
| Tenor | Yield (Aug 2026) | Significance |
| 10-year | 2.95% | Highest since September 1996 |
| 2-year | 1.75% | 31-year high |
| 5-year | 2.21% | Record high |
The MoF’s own assessment is that demand has plateaued, evidenced by weak bids at the last two 10-year auctions. Tokenization is therefore being evaluated as a demand-side intervention — not a technology experiment for its own sake.
3.3 Stablecoin Market Structure — The Yen Gap
| Metric | Value |
| Global stablecoin issuance | ≈US$310 billion |
| USD-denominated share | 83% |
| JPYC cumulative issuance (domestic) | ¥3 billion |
| JPYC total transaction volume | ¥35 billion / US$136 million |
| HashWallet monthly stablecoin settlement | ≈¥1 billion |
| HashWallet monthly growth | >30% |
| HashWallet users | 1.15 million |
The arithmetic is stark: yen stablecoins represent a fraction of a percent of the global stablecoin stock, while Japan is the world’s largest creditor nation and holds the largest sovereign-debt stock relative to GDP among advanced economies. The Digital Agency’s programmable-subsidy study and the megabank shared-yen-stablecoin plan are both attempts to create captive domestic demand for regulated yen stablecoin rails.
4. Market Effect & Transmission Channels
4.1 Sovereign Debt — New Marginal Buyer Base
The most immediate market effect is the potential creation of an on-chain marginal buyer for JGBs. The MoF’s explicit logic is that overseas investors already holding assets on-chain would gain a stable place to park idle cash in JGBs, with streamlined collateral and liquidity management as the operational pull. If tokenized JGBs achieve even a single-digit percentage of the US$1.6 trillion repo market, that represents tens of billions of dollars of new collateral mobility — material against a backdrop of auction weakness and record debt-servicing costs.
4.2 Bank Business Models — Fee Income & Collateral Velocity
For the megabanks, tokenized JGB repo with stablecoin cash legs targets T+0 settlement and 24/7 availability, reducing the operational intensity of traditional repo (multi-day cycles, bilateral custody, manual reconciliation, limited hours). The JBA’s parallel work on next-generation interbank settlement indicates banks are preparing for a world in which deposit tokens and stablecoins compete for settlement balances, and in which non-financial business integration becomes possible on-chain.
4.3 Cross-Border & Asia Interoperability
The FSA and MoF have committed to launching a new Asia public-private policy dialogue framework, with “Asia Day 2027” scheduled for February 2027. Japan is ASEAN+3 co-chair in 2026, with cross-border digital payments as a priority agenda item. The MoF explicitly links on-chain cross-border payments to “improving the convenience of the yen” and to G7/G20 regulatory coordination. This positions Japan’s on-chain finance push as a currency-internationalisation vector, not merely a domestic efficiency play.
4.4 RWA & Interoperability Infrastructure
Japan’s Pacific Meta has selected Chainlink CCIP as its preferred cross-chain interoperability solution for institutional tokenization, a signal that Japanese institutional RWA flows are being designed with cross-chain portability in mind from the outset. The Progmat Tokenized JGB / On-chain Repo Working Group — whose members include MUFG, Mizuho, SMBC, State Street, SBI Securities, JPX Market Innovation & Research, and BlackRock Japan — is targeting a comprehensive report in October 2026, with potential TJGB issuance pilots before year-end.
5. Sentiment Analysis
5.1 Official / Policy Sentiment — “Sober Institutional Urgency”
The dominant tone across the minutes is not enthusiasm for crypto markets, but a calculated, fiscally motivated institutional urgency. Three sentiment markers stand out:
1. Explicit rejection of crypto-speculation framing: The FSA and MoF consistently frame on-chain finance as settlement infrastructure, collateral management, and public payment rails — not as an asset-class promotion exercise. The forum title itself centres “AI-era finance,” not blockchain speculation.
2. “Chicken-and-egg” acknowledgement: Multiple participants conceded that Japan has suffered from a stalemate in which infrastructure does not advance because use-cases are absent, and use-cases do not emerge because infrastructure is absent. The government’s decision to “step forward” and coordinate ministries is framed as the deliberate breaking of that stalemate.
3. Trust and auditability as preconditions: Expert members emphasised that auditable trails, KYC/transaction lineage, and third-party assurance frameworks must be built into on-chain settlement architecture, rather than treated as afterthoughts — a sentiment consistent with Japan’s legacy-infrastructure-first regulatory culture.
5.2 Private-Sector / Market Sentiment — “Cautious Optimism, Normalisation Tailwind”
Japanese investor sentiment entering 2026 was characterised in contemporaneous analysis as “sober optimism” , with ≈26% of institutional and retail investors still viewing the market as in a “bearish phase” at the start of the year. The on-chain finance minutes do not appear to have triggered a sentiment regime shift in crypto-asset markets; rather, they have reinforced a separate, TradFi-centric narrative around institutional tokenization and settlement modernisation.
The normalisation of interest rates is cited in the minutes as a tailwind: corporates are reducing idle cash and seeking yield, while banks face scarcity of liquidity deposits — conditions that increase the appeal of programmable cash management and tokenized collateral for both sides of the balance sheet.
5.3 Cross-Border Sentiment — Japan as “Asia’s Institutional Tokenization Lead”
The Progmat working group and Chainlink/Pacific Meta developments have positioned Japan in international market commentary as “poised to lead Asia in on-chain government-bond innovation,” delivering faster settlement, reduced counterparty risk, and broader participation in its repo market. The inclusion of BlackRock Japan and State Street in the TJGB working group is a sentiment signal to global institutional allocators that Japanese tokenization is being designed with international custody and asset-management participation from the start.
6. Forward Roadmap & Catalysts
| Date / Window | Milestone |
| October 2026 | MoF expert study group on JGB tokenization convened (8 Oct); Progmat TJGB working group comprehensive report expected |
| Before end-2026 | Potential tokenized JGB issuance pilot; commercialisation decision on JGB tokenization targeted within 2026 |
| Early 2027 | FSA interim report and public-private cooperation roadmap; work begins on national blockchain settlement system for stocks and bonds |
| February 2027 | “Asia Day 2027” — FSA/MoF-hosted Asian public-private policy dialogue |
| By March 2027 | Megabank shared yen stablecoin for business payments (PIP-backed) |
| Through 2027 | BOJ DLT sandbox real-world testing with selected financial institutions |
| Early 2028 | BOJ DLT sandbox results |
| Early 2030s | Potential operational launch of national blockchain settlement system for stocks and bonds |
7. Bottom Line
The minutes confirm that Japan’s on-chain finance strategy is infrastructure-first and fiscally motivated: the binding constraints being addressed are JGB demand plateau, record debt-servicing costs, settlement gridlock risk, and the near-absence of yen stablecoin rails — not crypto trading volumes. The US$1.6 trillion JGB repo market is the anchor asset class; programmable public subsidies are the demand-side experiment; BOJ reserve settlement is the finality layer; and the JBA’s interbank study group is the private-sector delivery vehicle. Official sentiment is urgent but conservative, market sentiment is cautiously constructive, and the interim report / roadmap in early 2027 is the next binary catalyst for whether this moves from study group to deployable infrastructure.
$POL $LINK $USDC
#KOSPIFallsMoreThan2% #BitMineAdds12535ETH #StrategyBuys267BTC #CFTCRebutsCMELegalStanceInPerpetualFuturesFight

SoverignLedger
·
--
KOSPI Opens -3.17%, Closes +1.76%
#kospifallsmorethan2%
KOSPI 19 OCT 2026
KOSPI Opens -3.17%, Closes +1.76% — V-Shaped Reversal on 1.9 Trillion Won Institutional/Foreign Bid
Clarification: the index did breach the -2% threshold — but only at the open. The session close was positive. Below is the full statistical breakdown.
1. INDEX LEVELS — OPEN vs. CLOSE
Metric ll Value
Previous close (16 Oct) 5,668.05
Opening print 5,488.41
Opening change -179.64 pts / -3.17%
Intraday low 5,488.41 (the open)
Closing print 5,768.01
Closing change +99.96 pts / +1.76%
Intraday swing (low to close) +279.60 pts / +5.09%
KOSDAQ close 808.89 (+14.11 pts / +1.78%)
KOSDAQ opening drop -21.72 pts / -2.73% (773.06)
The KOSPI opened 3.17% lower, then reversed to close at the intraday high — a full 5.09% low-to-close recovery.
2. INVESTOR FLOWS — WHO BOUGHT THE OPENING CRASH
Investor Type Net Flow (KOSPI)
Institutions +878.9 billion won (net buy)
Foreigners +624.7 billion won (net buy)
Individuals -1.9291 trillion won (net sell)
Institutional and foreign buying combined: ~1.50 trillion won absorbed the individual selling wall. Foreigners had been net sellers for 8 consecutive sessions before flipping to net buy — a flow reversal that directly coincided with the index bottom at the open.
3. SEMICONDUCTOR “TWO TOP” — OPENING CRASH vs. CLOSE
Stock Opening Decline Intraday Low Closing Change Closing Price
Samsung Electronics -3.94% -4.18% (206,500 won) +1.16% 218,000 won
SK Hynix ~ -4% -5% +0.39% 1,277,000 won
Both stocks opened deep in negative territory and finished green — a combined intraday reversal of roughly 5–6 percentage points each. SK Hynix was the #1 foreign net-sell name (-217.6 billion won) yet still closed positive; Samsung Electronics was the #1 foreign net-buy name (+172.0 billion won).
4. MARKET CAP DESTRUCTION — OCTOBER CONTEXT (1–16 OCT)
Metric 1 Oct 16 Oct Change
KOSPI total market cap 5,752.05 tn won 4,679.49 tn won -1,072.56 tn won (-18.65%)
KOSPI index 6,971.35 5,668.05 -1,303.30 pts (-18.70%)
Samsung Elec. mkt cap 1,613.57 tn won 1,259.87 tn won -353.70 tn won
Samsung Elec. share price 276,000 won 215,500 won -21.92%
SK Hynix mkt cap 1,338.99 tn won 929.19 tn won -409.81 tn won
SK Hynix share price 1,833,000 won 1,272,000 won -30.61%
Samsung + SK Hynix — — -763.51 tn won
combined loss
Two-stock share of total — — 71.19%
KOSPI cap loss
Stock breadth (1–16 Oct): 652 decliners / 940 total (69.4%); 254 advancers (27.0%); 34 flat (3.6%). 168 stocks fell ≥10%; average stock return: -3.38%.
The two semiconductor names alone accounted for 71.19% of the entire KOSPI market-cap wipeout — the concentration risk that amplified the opening crash.
5. WEEKLY DRAWDOWN CONTEXT — 12–16 OCT
Metric Value
KOSPI weekly decline (12–16 Oct) -14.45%
Rank since 2000 Worst since Oct 2008 (-20.5%)
vs. Dot-com bust (Oct 2000) Worse (-14.45% vs. -13.8%)
vs. COVID crash (Mar 2020) Worse (-14.45% vs. -13.2%)
Peak-to-trough (22 Jun peak 9,114.55) -38% in 84 trading days
The prior week’s -14.45% was the steepest weekly loss since the Global Financial Crisis — the opening crash on 19 Oct was a direct continuation of that momentum before the reversal.
6. EXTERNAL TRIGGERS — HARD NUMBERS
Trigger Statistic
Philadelphia Semiconductor Index -3.83%
Nasdaq Composite -2.15% / -2.14%
Dow Jones Industrial Average -0.34%
CoreWeave (AI infrastructure) -11.91%
US 10-year Treasury yield >5.00%
Samsung + SK Hynix combined KOSPI cap weight 46.7%
Foreign net selling, KOSPI YTD to 16 Oct -208.33 tn won
Foreign net selling, prior week alone >11 tn won
The transmission channel was explicit: CoreWeave -11.91% → SOX -3.83% → KOSPI open -3.17%, against a market where two stocks carry 46.7% of total index weight.
7. ANALYST SUPPORT / RESISTANCE — STATISTICAL RANGE
Source / Metric Level / Range
iM Securities — core support zone 5,100–5,340
iM — 12M fwd PBR 1x ~5,100
iM — 78.6% retracement of 2026 rally 5,338
iM — prior capitulation median projection 4,788
Yuanta — sentiment floor ~5,500
Hana — 2nd trough estimate 5,300
Hana — 12M fwd PBR 1x 5,150
NH Investment — weekly expected band 5,100–6,100
Kiwoom — weekly expected range 5,200–5,900
Consensus near-term low zone 5,200–5,500
The 5,100–5,340 zone is the densest statistical support cluster (PBR 1x + Fibonacci confluence). The 5,500 level is the sentiment-based floor cited by Yuanta; the index closed at 5,768 on 19 Oct, roughly 4.9% above that floor.
8. SENTIMENT — WHAT THE DATA SAYS
Indicator ll Reading ll Signal
Foreign flow ll +624.7 bn won (net buy) after 8 sessions of selling ll Marginal positive — not yet confirmed trend
Institutional flow ll +878.9 bn won ll Supportive
Individual flow ll -1.93 tn won ll Capitulation / stop-loss driven
Intraday reversal ll +5.09% low-to-close ll Short-term oversold bounce
KOSPI 20-day divergence ll -16.9% (15 Oct) — bottom 0.4% since 1999 ll Extreme oversold; historically not an immediate buy signal
Breadth ll 69.4% decliners (Oct) ll Broad-based damage; reversal narrow
Semiconductor weight ll 46.7% of index ll Structural fragility remains
Bottom line on sentiment: The reversal was flow-driven and statistically extreme, but narrow — two stocks did the heavy lifting. Foreign buying on 19 Oct (+624.7 bn won) is a 1-day print, not yet a trend reversal; the prior 8-session selling streak and -208 tn won YTD outflow remain the dominant flow fact.
9. FUTURE DIRECTION — DATA-CONDITIONED SCENARIOS
Scenario ll Statistical Basis ll Implied KOSPI Range
Base case: W-shaped bottom ll 20-day divergence -16.9% historically leads to further -13.8% median drawdown over 40 sessions before recovery ll Test 5,150–5,300 → rebound → retest
Bull case: bottom confirmed at 5,488 ll Foreign + institutional combined +1.50 tn won net buy; closing at intraday high ll Hold 5,500+ → challenge 5,900–6,100
Bear case: capitulation extends ll Historical median post-divergence drawdown projects 4,788; 2008/2020 precedent: -15% to -17% additional in 2–3 sessions ll Break 5,100 → 4,800–4,900
Key catalyst checklist (all binary / data-release driven):
US Big Tech earnings (Meta, Tesla this week): AI capex guidance → direct read-across to KOSPI semis
Bank of Korea MPC: rate decision → domestic liquidity signal
Samsung / SK Hynix earnings (late Oct): the 46.7% index weight makes this the single largest KOSPI-specific volatility event
US 10-year yield: hold above 5.0% = continued discount-rate pressure on tech
Foreign flow persistence: +624.7 bn won on 19 Oct must extend beyond 1 session to validate the reversal
One-line statistical summary: -3.17% open, +1.76% close, +5.09% intraday swing, 1.50 tn won institutional + foreign bid vs. 1.93 tn won individual sell, two stocks = 71.19% of October’s market-cap loss, support cluster 5,100–5,340, resistance 5,900–6,100.
$BTC $ETH $SOL
#USBitcoinETFsRecord$527MInflows #ElicePlunges33%InKoreanIPODebut #GoogleSetsUAELicensingRulesForCryptoAds #GoogleSetsUAELicensingRulesForCryptoAds

SoverignLedger
·
--
🚩🚀 $NEAR Intents Hits Record September Performance
NEAR Intents processed a new all-time monthly high of $4.80B in swap volume in September 2026.
Key stats:
+72.9% month-over-month vs August (~$2.78B)
Surpassed prior peak of $3.66B (November 2025)
Fees generated: $7.33M (+90.9% MoM)
This reflects accelerating adoption of NEAR’s intent-based cross-chain execution layer (bridgeless swaps across 30+ chains via competing solvers). Recent 30-day volumes have hovered near $4.7–4.8B, with confidential execution and new product launches (limit orders, confidential perps, tokenized assets) contributing to the uptick.
All-time volume now exceeds $34B. Strong on-chain activity continues to support ecosystem momentum.
Data sources: DefiLlama / Dune / NEAR Intents metrics.
#NEARUSDT
#EtherETFsExtendOutflowsToNineDays #EthereumSurpasses2500USDT #XRPLedgerPatchesXRPCreationBug #STRKRisesAbout20%In24Hours

SoverignLedger
·
--
Bitcoin options volatility has hit multi-year (including five-year) lows
#bitcoinoptionsvolatilityhitsfiveyearlow
Bitcoin options volatility has hit multi-year (including five-year) lows as of mid-October 2026.
Current levels
Deribit’s DVOL (30-day implied volatility index, the main crypto “VIX” equivalent) recently sat around 37.4, described as “Very low · 5y” relative to its five-year history.Near-month/at-the-money implied volatility has been reported near 33.5%, more than 4 percentage points below recent realized volatility — meaning options are pricing less movement than the market has actually delivered. Shorter-dated readings (1-week ATM IV) have traded even lower at times this year (into the high-20s to low-30s during summer lulls).
These are among the lowest readings in the available multi-year history of liquid Bitcoin options markets (which became meaningfully deep around 2021 onward). Realized volatility has also compressed sharply over successive cycles, reflecting Bitcoin’s maturation with deeper institutional participation, ETFs, and options liquidity.
Context from 10x Research (Oct 12, 2026)
A fresh note from 10x Research highlighted that Bitcoin options prices reached five-year lows. Key points:
Near-month IV at 33.5% looks relatively cheap versus realized vol. Skew has softened (declined ~3 points over the prior week). Large put buying appeared in October-expiry strikes around $78k–$80k (including block trades up to ~$204 million notional). This is interpreted as existing long holders hedging downside rather than a broad shift to outright bearish positioning.
Ethereum options have shown different dynamics (more call-selling pressure and IV above realized in some recent reads).
Broader picture
Volatility compression has been a recurring theme through 2026, with multiple multi-month or multi-year lows printed earlier in the year (e.g., summer lulls with 1-month IV near 28–36%). Realized vol has fallen even faster at times, though extreme “3-sigma” daily moves have still occurred more frequently than in some prior high-vol years like 2018 when measured relative to the lower baseline volatility.
Low implied volatility makes options cheaper to buy (for directional bets or hedges) but also reflects market expectations of continued range-bound or lower-volatility conditions. Historically, prolonged low-vol regimes in Bitcoin have often preceded larger moves once a catalyst arrives, though timing is uncertain.
Data sources include Deribit DVOL, Volmex BVIV, Glassnode, and options analytics platforms. Levels can shift quickly with price action or macro events.
$BTC $ETH $SUI
#BitcoinReclaims$84K #FSBWarnsCrossBorderStablecoinRulesRemainUnderdeveloped #TokenizedStockMarketCapHitsRecord$3.9B #EthereumSpotETFsSee$542MNetOutflowLastWeek
SoverignLedger
·
--
SOL Treasury Strategy Update
DeFi Development Corp. (Nasdaq: DFDV) | SOL Treasury Strategy Update
Date: October 12, 2026
Key Highlights
SOL Holdings: Added ~22,070 SOL + SOL equivalents in the week ended Oct 9 → Total: ~2,586,282 SOL (≈ 12% growth since Aug 12 earnings update). Prior milestones: ~2.56M as of early Oct (valued ~$302M), >2.5M by late Sep; >226k SOL added since Aug 12. CHAD Preferred Stock (Nasdaq: CHAD): Hit all-time highs during the week despite broader crypto selloff. Carries 13% annual dividend rate ($1.30/share on $10 stated amount), paid daily when declared. First dividend paid Oct 1. Capital Structure: $300M CHAD At-The-Market (ATM) program in place (issuance targeted at/above $10 par). Board authorized open-ended repurchase program for up to all outstanding CHAD shares (intended only if trading below par after first reaching $10). DFDV Common Shares: Down ~2.2–3% on Oct 12; ~19–21% lower over the past week (trading ~$4.40 range). Market cap ~$143M. High short interest (~33%). Analyst consensus Strong Buy with ~$8.70 target.
Statistical & Data Analysis
Metric // Value // Notes / Context
SOL Holdings (latest) // ~2.586M SOL + equivalents // +12% since Aug 12 Weekly addition // ~22,070 SOL // Purchases + organic (staking/yield) Prior week (late Sep–early Oct) // ~26k SOL // Slowing pace from peak weeks (101k mid-Sep) Treasury value (early Oct) // ~$302M // At then-prevailing SOL prices SOL Price (Oct 12) ~$109–$113 // ~8% lower over 7 days; consolidating after mid-Oct pullback from ~$120+ SOL 7D / 30D performance // ~–8% / +9–10% // Volatile; longer-term structure still above key MAs CHAD Dividend // 13% annual // Income vehicle backed by productive SOL treasury DFDV vs SOL // DFDV underperformed recently // Common shares more volatile; strategy aims for rising SOL-per-share over time NAV/SOL-per-share (prelim Q3) // Double-digit SOL/share growth; >100% NAV/share growth (Aug 12 → Sep 30) // Subject to finalization
Accumulation Pace: Steady but moderating from peak weekly buys earlier in Sep. Combination of open-market purchases + organic compounding via staking/validators/on-chain treasury ops.
Valuation Context: mNAV historically traded at a discount (treasury value has exceeded market cap in recent reports). High beta and short interest amplify equity swings relative to SOL.
Market Efforts & Strategy Execution
Core Flywheel: Raise capital (common equity + CHAD preferred) → accumulate/compound SOL → generate yield (staking, validators, on-chain) → grow SOL-per-share and NAV for common holders without diluting via preferred issuance.
CHAD as “Digital Credit”: Designed as non-dilutive (to common) permanent capital. $11M initial offering + $300M ATM expands capacity. Repurchase authorization provides downside support flexibility near/below $10.
Ecosystem Alignment: Management highlights tokenized equities volume on Solana and Samsung’s integration of stablecoin (USDC) functionality into Samsung Wallet / Pay for ~82 million U.S. Galaxy devices (launch late Oct 2026, Solana + Sui infrastructure). Viewed as structural demand driver for Solana in payments/finance.
Deployment: Treasury SOL targeted for staking, validator infrastructure, and productive on-chain use (subject to risk management).
CEO Joseph Onorati: “Short-term volatility has not changed our conviction or our commitment to accumulating SOL… These developments point toward a much larger role for Solana in global finance.”
CSO Dan Kang: CHAD’s relative strength shows investors recognizing its distinct income proposition backed by the SOL treasury.
Sentiment & Market Context
Bullish elements: Continued accumulation through weakness, CHAD resilience (income demand), first dividend paid, expanding capital access, positive Solana ecosystem catalysts (Samsung, tokenization). Management tone remains highlyconstructive on long-term SOL role.
Bearish / Cautious elements: SOL and risk-asset selloff pressure, DFDV equity underperformance and high short interest, slower weekly buy pace recently, broader crypto volatility. Equity trades with amplified beta to SOL.
Overall Tone: Constructive on strategy execution and long-term thesis; short-term price action remains choppy. CHAD offers income differentiation vs pure SOL beta.
Disclaimer: This is a factual summary of company announcements and public market data for informational purposesonly. Not investment advice. Digital assets and equities involve significant risk of loss. Verify latest filings (8-K, press releases) and prices independently. Past performance is not indicative of future results.
Sources: Company GlobeNewswire releases (Oct 12, Oct 8, Oct 5/6), SEC filings/8-Ks, The Block, market data as of Oct 12, 2026.
$SOL $SUI $USDC
#solana #BitcoinOptionsVolatilityHitsFiveYearLow #BitcoinReclaims$84K #FSBWarnsCrossBorderStablecoinRulesRemainUnderdeveloped #TokenizedStockMarketCapHitsRecord$3.9B

SoverignLedger
·
--
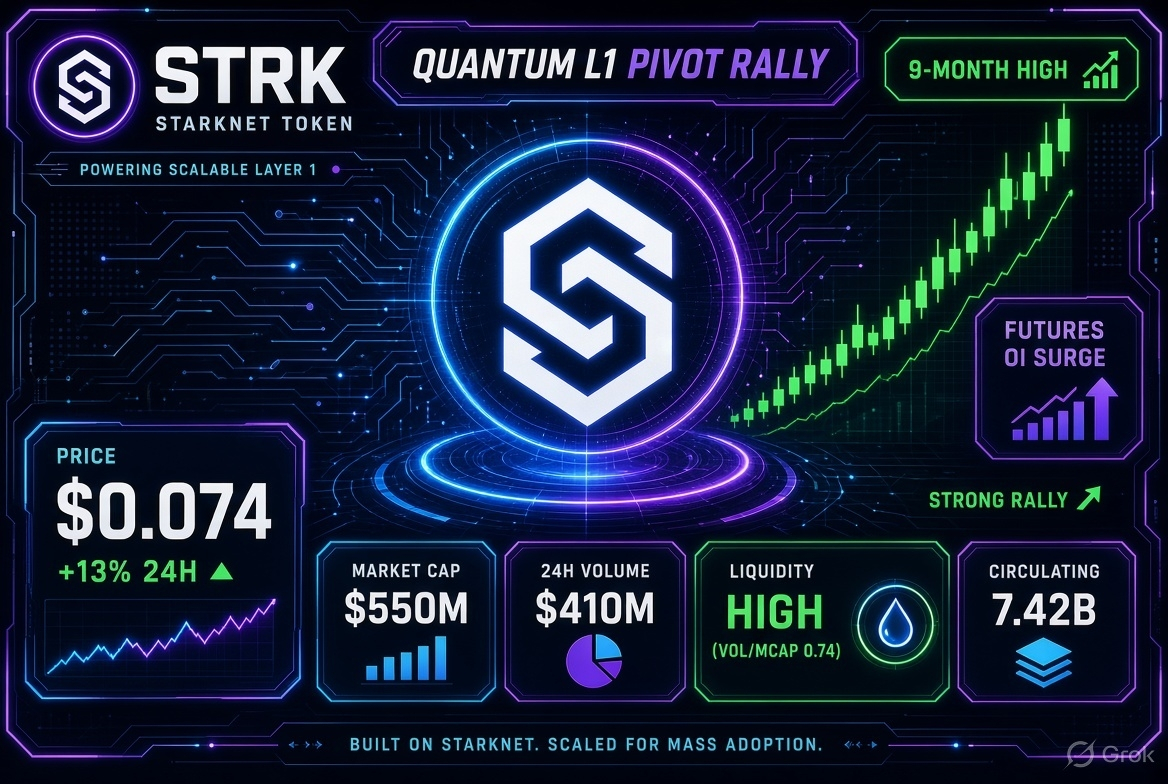
🚀STRK🔺 pumps hard after Starknet floats leaving Ethereum L2 for its own quantum-resistant L1 by 2027. Hit 9-month high near $0.07, +25-40% 🔺in a day. Futures OI up 50%+.
STARKNET also strike on Indian Market,it's effects comeout👍
$STRK
#STRKRisesAbout20%In24Hours
#TetherFreezesUSDTLinkedToLedgerTheft #CFTCMovesToFoldEventContractsIntoSwapsRules #LedgerPausesCryptoBilisSales #NEARAccountsSupportPostQuantumMLDSA
STARKNET also strike on Indian Market,it's effects comeout👍
$STRK
#STRKRisesAbout20%In24Hours
#TetherFreezesUSDTLinkedToLedgerTheft #CFTCMovesToFoldEventContractsIntoSwapsRules #LedgerPausesCryptoBilisSales #NEARAccountsSupportPostQuantumMLDSA
SoverignLedger
·
--
XRPL Critical Vulnerability Patch
#xrpledgerpatchesxrpcreationbug
XRPL Critical Vulnerability Patch – Full Details, Stats, Analysis, Market Effects & Outlook (As of October 10, 2026 – ready for internal briefing, trader notes, or public summary)
Core Event Summary
The XRP Ledger (XRPL) successfully patched a critical, decade-old (≈2015) vulnerability that could have allowed an attacker to mint and spend new XRP “out of thin air,” violating the hard-capped 100 billion fixed supply.
Discovery: Reported privately on September 22, 2026 by researcher Cayden Liao + Veria AI via the XRPL Bug Bounty program (initially rated Major; elevated to Critical).Confirmation: RippleX engineers reproduced the exploit on an isolated standalone server; the generated XRP was fully spendable. Patch: Emergency software release xrpld v3.4.1 on September 25, 2026. Public Disclosure + Source Code: Full technical report released October 9, 2026 (once the network was secured). Outcome: No evidence of exploitation on any public network. Zero funds lost. Supply integrity remains intact.
Technical Mechanism (Integer Overflow)
The bug lived in the built-in DEX/payment engine. An attacker could:
Open hundreds of accounts and place artificially high-priced offers (tiny token amounts for large XRP).Execute one massive payment consuming those offers. Trigger a 64-bit integer overflow → total “wraps around” to a near-zero value.
Result: Sellers credited full amounts; buyer charged almost nothing + fee → net new XRP created.
The exploit bypassed:
Automated invariant checks (same flawed arithmetic).Single-account caps (by scattering minted XRP).
Ordinary transactions could never reach the overflow threshold. Cost to attempt: only a few hundred XRP in recoverable reserves + fees. Theoretical max mintable in one tx: far beyond the entire 100B supply.
Deployment & Transparency Stats
Emergency path: Bypassed standard amendment voting (>80% validators for 2 weeks) for the first time in >10 years on a transaction-processing change. Fix applied immediately on upgrade. Adoption: >80% of default Unique Node List (UNL) validators running 3.4.1 by release day (Sept 25). Related fix: Same release included fixBatchV1_2 amendment (Batch inner-tx validation); activated on Mainnet Oct 9. Older servers now amendment-blocked. Rationale for opacity: Source withheld initially to prevent reverse-engineering during rollout. Full code + report published Oct 9 once safe.
Market Statistics & Price Action (as of ~Oct 10, 2026)
Metric Value Notes
Current Price ≈ $1.40 +0.5% to +1.7% on
the day of disclosure
24h Change +0.5% – +1.7% Mild recovery
7d Change ≈ –5% to –6% Broader crypto
pullback,
not bug-specific
Market Cap ≈ $88.5–88.6B Circulating supply
≈ 63.13B XRP
FDV ≈ $140B Max supply 100B
24h Volume ≈ $1.1–1.9B Mixed reports; some
sources note volume drop
Recent Range $1.32 – $1.66 (30d) ATH ≈ $3.65–3.66 (Jul 2025)
Price path around key dates:
Sept 25 (patch day): Closed ≈ $1.56–1.57 (high of day ≈ $1.63). Oct 8–9 (pre/post disclosure): Dip to ≈ $1.32–1.38, then rebound to $1.40. No panic dump or volume spike attributable to the news. Market treated it as a “theoretical hole closed before anyone fell in.”
Market Effects & Sentiment Analysis
Immediate reaction: Collective shrug. Price tracked broader market rather than the disclosure. No liquidation cascades or exchange delistings. Sentiment: Predominantly positive/neutral among informed participants. News sentiment scores high (e.g., one aggregator at 91/100 positive over 7 days). Community and analysts praise the rapid private reporting → fix → transparent disclosure sequence. Institutional lens: Supply-cap integrity is foundational for institutional use cases (ETFs, treasuries, payments). Recent inflows (e.g., ≈$8M into U.S. spot XRP ETFs on one day) continued. Evernorth’s large XRP treasury and other institutional pipelines remain on track. Criticisms: Some debate on the emergency bypass of validator voting (sets a precedent). Temporary open-source scrutiny during the binary-only phase, resolved by full disclosure. Perpetual / Ongoing Dynamics: No sustained selling pressure. Perpetual futures open interest and funding rates remain orderly (no extreme long/short skew tied to the event). Liquidity and order-book depth on major exchanges showed no structural damage.
Future Effects & Outlook
Short-term (weeks):
Minimal residual risk. All operators urged to run ≥3.4.1; older nodes blocked.Expect continued focus on Batch feature activation and other protocol upgrades.
Medium-term (months):
Reinforces XRPL’s security maturity and bug-bounty effectiveness.Strengthens the fixed-supply narrative that institutions rely on. Possible mild positive catalyst if framed as “proof the system works under stress.”
Longer-term:
Precedent of emergency software fixes without full amendment may be revisited in governance discussions. Heightened scrutiny on arithmetic and invariant checks across the codebase. Overall net positive for credibility: a critical supply-risk bug existed for ~11 years, was responsibly disclosed, patched in 3 days, and never exploited.
Bottom line for traders/exchanges:
Supply integrity confirmed intact. No lost funds. Market reaction muted and constructive. Event is a non-event for price discovery in the near term and a quiet win for protocol resilience. Monitor validator upgrade completion and any follow-on governance proposals.
Sources: Official XRPL vulnerability disclosure (Oct 9), xrpld 3.4.1 release notes, multiple market data providers (CoinMarketCap, Investing.com, etc.), and contemporaneous coverage.
$XRP $XRPN.US $XRPT.ETF
#STRKRisesAbout20%In24Hours #EthereumSurpasses2500USDT #StateCouncilCallsForNationalBlockchainNetwork #TetherFreezesUSDTLinkedToLedgerTheft
⚠️Article is for Study purpose,invest on your risk⚠️
SoverignLedger
·
--
STRK EXCHANGE MARKET NOTE
#strkrisesabout20%in24hours
STRK EXCHANGE MARKET NOTE Starknet (STRK) — Full Market Update | 10 October 2026 (≈08:00 IST)
Price & Core Statistics
Metric Value Notes
Last price $0.0730 - $0.0740 Live acro major venues
24th change +25.2% to +30% Stong continue of Oct 8-rally
24th high/low $0.0765 - $0.0772 Wide rane shows valatility
$0.0553 - 0.0599
7d chnge +65% - + 71%
30d change +126% - +132%
1y change -53% to 58% Still deep from previous cycle
Market cap $540M - $548M Rank = # 88
Fully Diluted valuation $730M- $751M -----------------
Circulating Supply 7.42B STRK ~74% of total
Total/Max supply ~10.17B/Unlimited or 10B ------------------
24th spot volume $417M-$430M -------------------
Volume/Market Cap ~76-79% Extremely high turnover
All-Time High: $4.41 (20 Feb 2024) — currently ≈98.3% below All-Time Low: $0.0222 (Aug 2026)
Liquidity & Market Structure Spot Liquidity Leaders: Binance, OKX, Bybit, Gate, Coinbase, KuCoin, MEXC Order Book Depth: Healthy on top venues (tight spreads on STRK/USDT pairs). Liquidity is well distributed (low concentration). Volume Share: Binance & OKX dominate spot; significant activity also on Bybit and regional exchanges. DEX Liquidity: Available on Uniswap (Ethereum) and Starknet native DEXes, but CEX remains primary venue. Slippage: Low for sizes up to several hundred thousand USD on major pairs; higher for very large orders.
Derivatives & Instruments Data Metric Approximate Value Details Total Open Interest (Perps) $80M – $107M Across 12–16 venues Top OI Venues Hyperliquid ≈ $33–36M - Bybit ≈ $27–34M Binance ---------- - ≈ $26–29M OKX ≈ $12–13M
24h Perp Volume Very high (often >$1B aggregated) Strong speculative interestFunding Rate (avg) +0.005% – +0.010% per Longs paying 4h / 8h (positive) shorts — bullish bias
Annualized Funding Mostly +8% to +11% ------- (some venues higher)
Funding Spread Noticeable between --------- venues (arbitrage possible)Instrument Notes:Spot: STRK/USDT (primary), STRK/USD, STRK/TRY, STRK/EUR available on select exchanges. Perpetual Futures: Widely listed (Binance, Bybit, OKX, Hyperliquid, Bitget, Gate, etc.). Max leverage typically 5–20× depending on venue. Options: Limited or none currently. ETF / Traditional Products: No STRK ETF exists. No spot or futures ETF approved. Exposure remains crypto-native only. Other: Some structured products and margin trading available on larger platforms.Catalyst & Fundamental Analysis Primary Driver (8–10 Oct 2026): Starknet officially stated it is actively considering becoming an independent Layer-1 blockchain with the target of becoming the first fully quantum-resistant network by 2027.Motivations cited by StarkWare CEO Eli Ben-Sasson: quantum computing threat + AI advances. Current status: Still an Ethereum L2 (STARK-based validity rollup). No formal governance vote or confirmed timeline yet — pure narrative-driven move so far. Market Interpretation:High volume-to-mcap ratio + rising open interest + positive funding = strong speculative long positioning. Price action shows aggressive FOMO buying followed by consolidation. Risk: Unconfirmed transition + potential token unlocks + broader market pullback could trigger sharp corrections. Risk & Trading Notes for Exchange Users Volatility: Extreme — 24–40% daily ranges possible. Liquidity Risk: Excellent on top 5 CEXes; thinner on smaller platforms. Leverage Warning: High funding + elevated OI increases liquidation risk during reversals. Recommended Instruments: – Spot for long-term holders – Perps for short-term directional / hedging trades – Avoid high leverage until volatility cools Trade STRK on our platform Spot • Perpetual Futures • Margin available Always conduct your own research. Crypto markets are highly volatile and can result in significant losses.Data sources: CoinMarketCap, OKX, Binance, PerpFinder, Proliquid, MetaMask Price, CoinOTAG & aggregated exchange feeds (as of early 10 Oct 2026). Prices and metrics update in real time.
$STRK
#XRPLedgerPatchesXRPCreationBug #TetherFreezesUSDTLinkedToLedgerTheft #CFTCMovesToFoldEventContractsIntoSwapsRules #EvernorthCompletesSPACMergerWithArmadaII

SoverignLedger
·
--
Blumenthal Probes Cantor Fitzgerald–Tether Ties
#senblumenthalprobescantorfitzgeraldtetherties
Blumenthal Probes Cantor Fitzgerald–Tether Ties (Updated Oct 9, 2026)
Headline / Key Development
U.S. Sen. Richard Blumenthal (D-CT), Ranking Member of the Senate Permanent Subcommittee on Investigations (PSI), sent a formal letter dated October 8, 2026 to Brandon Lutnick, Chairman of Cantor Fitzgerald. The letter demands detailed records on Cantor’s relationship with Tether (USDT issuer), compliance practices, revenue, and Lutnick family financial arrangements. Response deadline: October 23, 2026.
This follows Blumenthal’s September 28, 2026 Democratic staff report titled “Tethered to Terrorism.”
Core Facts & Statistics
Cantor’s stake: ~5% equity stake in Tether (acquired/rights obtained around 2024). Blumenthal’s letter alleges the estimated value of this stake rose from ~$600 million to ~$10 billion since Trump returned to office. Reserves role: Cantor manages/custodies a large share of Tether’s U.S. reserves (primarily U.S. Treasury bills). Reports cite tens of billions to >$100 billion in assets under Cantor’s oversight. Tether has stated the vast majority of its assets are held in the U.S. under this custodianship (Tether claims operations based in El Salvador). Tether scale (latest cited): As of June 30 (2026 reporting), Tether reported $187.75 billion in assets, $183.64 billion in liabilities, and $4.11 billion excess reserves. Family financials cited in letter: Howard Lutnick (former Cantor Chairman/CEO, now Commerce Secretary) allegedly received >$250 million in the relevant period, including a $192 million distribution from Cantor Fitzgerald. Letter seeks details on any Tether-linked loans/financing related to ownership transfer to his children (Brandon and others now lead the firm). Prior communications: Letter requests all communications involving Howard Lutnick about Tether, including after he left Cantor.
“Tethered to Terrorism” Report Key Stats (Sept 28, 2026)
Reviewed 846 wallets designated by OFAC and Israel’s National Bureau for Counter Terror Financing (June 2021 – August 2026). ~84% of these wallets transacted exclusively or nearly exclusively in USDT. Israeli designations: 87% predominantly USDT. OFAC designations: 57%. Two sanctioned Iranian oil smugglers (Alireza Derakhshan and Arash Estaki Alivand) moved >$603 million in USDT (2021–2025) through networks linked to Hezbollah, Houthis, and Iranian institutions. Report claims $34.6 million continued moving through some sanctioned wallets after designation (pre-2024 freezing practices criticized). Tether’s response note: Company stated it helped freeze ~$550 million in Iran-affiliated USDT during 2026 (including >$344M in April and >$130M in July).
Letter Requests (Summary)
Description of steps Cantor has taken to investigate allegations of USDT use in illicit finance/money laundering (Iran shadow banking, Russia sanctions evasion). Banking & sanctions compliance safeguards. Revenue generated from Tether relationship. Whether Cantor requires independent audits of Tether; any consideration of terminating the partnership. Family financial arrangements, ownership transfer details, and related communications.
Blumenthal quote (paraphrased from letter): Cantor has “profited from its relationship with Tether” while the arrangements come “at the expense of America’s national security.” He frames the probe as examining both illicit crypto use and potential self-enrichment/self-dealing linked to the Trump administration.
Context & Timeline
Cantor’s custodial relationship with Tether dates back to at least 2021 (WSJ reported earlier treasury oversight; expanded with USDT growth). Howard Lutnick negotiated the 2024 stake while leading Cantor; stepped down after confirmation as Commerce Secretary (Feb 2025); sons (Brandon as Chairman) assumed leadership. Additional background noted in coverage: Prior letters from Sens. Warren & Wyden (April 2026) on reported family-trust loan; Cantor donation to Tether-linked PAC; joint Twenty One Capital venture (Cantor/Tether/SoftBank, announced 2025, focused on Bitcoin treasury). Probe status: Currently Democratic minority investigation. Coverage notes potential for expanded authority if Democrats gain Senate majority post-November 2026 elections. Blumenthal has also referred findings to Treasury and DOJ.
Analysis Points for Exchange Audience
Conflict-of-interest angle: Dual role as major shareholder + primary U.S. reserve custodian raises questions about incentives for rigorous sanctions/AML oversight of the product that generates fees and equity upside. Systemic importance: USDT is the dominant stablecoin; Cantor’s custody of a large portion of its dollar backing makes this a potential systemic/regulatory flashpoint for stablecoin legislation and enforcement. Political framing: Letter explicitly ties the issue to administration self-dealing and national security (Iran/Russia sanctions). Expect partisan pushback emphasizing Tether’s freezes, economic utility of stablecoins, and that designated wallets represent a small fraction of overall USDT volume. Market/regulatory implications: Heightened scrutiny on Tether reserves transparency, independent audits, and Wall Street intermediaries. Could influence broader stablecoin bills, banking partnerships, and enforcement priorities. No immediate market reaction quantified in initial coverage; watch for Cantor/Tether formal responses and any subpoena/hearing escalation. Open items: Cantor and Tether had not issued public responses in initial Oct 8–9 reporting. Full letter PDF available via HSGAC/Senate site. Independent verification of stake valuation and exact reserve amounts under Cantor remains based on the letter/report claims and prior media.
Sources: CoinDesk (Oct 8–9), official Blumenthal letter (Oct 8 PDF), CryptoBriefing, Cointelegraph summaries, prior “Tethered to Terrorism” report coverage (Decrypt et al.). Data as reported; valuations and some reserve figures are estimates cited by the Senator/staff.
Suggested post tone: Neutral/factual with clear stats and timeline. Flag that this is an ongoing minority probe with political dimensions. Update later with any official responses or new disclosures.
$USDT $TETH.ETF $BTC
Market sentiment is risk-off after broad crypto weakness and renewed ETF outflows
#BitcoinDipsBelow$81K #SenBlumenthalProbesCantorFitzgeraldTetherTies #SecuritizeSharesRiseOver10%AfterTokenizedStocksLaunch #BitcoinLifeInsurerMeanwhileRaises$37.5M

SoverignLedger
·
--
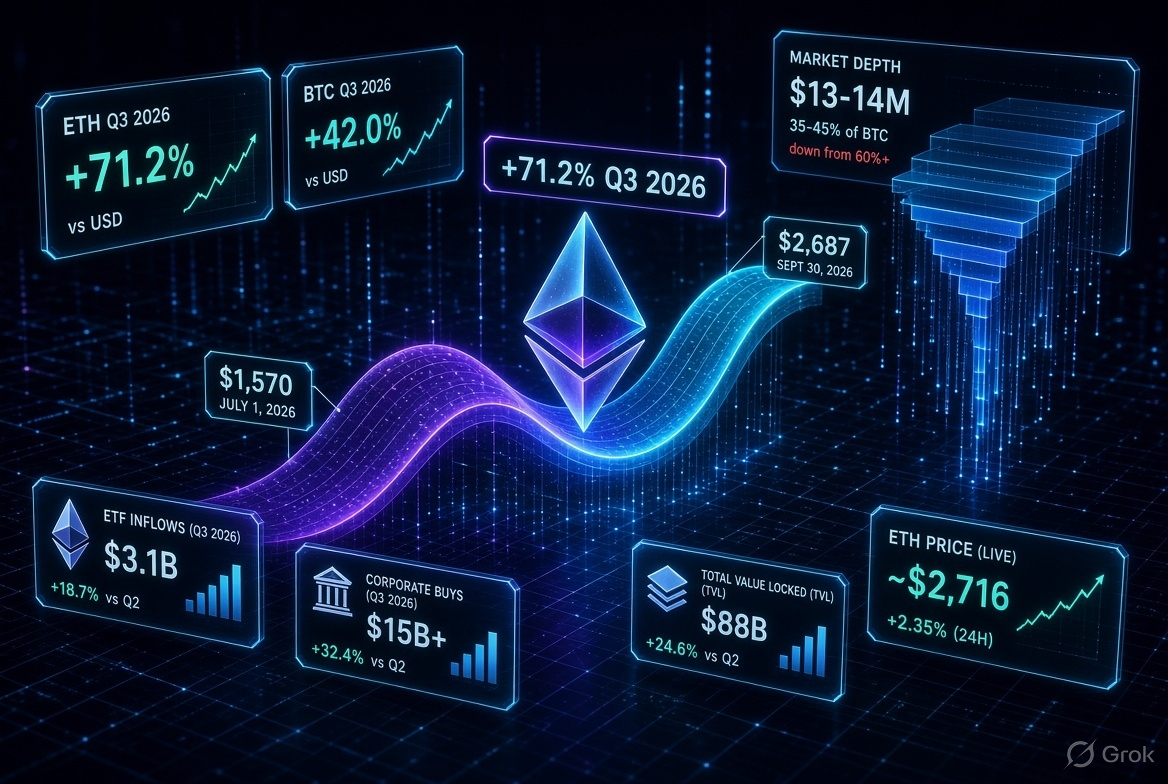
#ETHUp70%InQ3ButLiquidityFalls
ETH’s short-term picture is constructive but fragile. As of 2026-10-06, ETHUSDT is around $2,716.05 on Binance Spot, down -0.66% from its 24-hour open of $2,734.04, after trading between $2,679.63 and $2,738.00.
What decides the near-term path:
Trend follow-through: On the 4-hour view, ETH is above its 7-, 25-, and 99-period moving averages, with the SuperTrend at $2,659.83. Holding that structure would keep the short-term recovery intact; losing it would weaken the setup.
Volume and liquidity: Current 4-hour volume is only 0.24× its 7-period average, so the latest bounce has not yet been backed by broad participation. Given the recent liquidity-thinning context, lower depth can make price moves less reliable and more abrupt.
Flow confirmation: The latest one-day reading shows a net inflow of 50,591.83 ETH, with a 12.75% net-inflow rate. Sustained spot demand would be a healthier confirmation than price alone; a reversal in flows alongside rising volatility would increase fragility.
The key quality signal is whether ETH can sustain demand with improving volume and deeper order books. The immediate market range is roughly $2,680–$2,740: acceptance above the upper end with stronger activity would indicate buyers are absorbing supply, while a break below the lower end amid rising sell volume would highlight liquidity-driven downside risk. This is a scenario framework, not a directional forecast.
Core takeaway: ETH’s Q3 strength is visible in trend data, but falling liquidity means price can move more sharply in either direction. Sustained spot inflows and volume recovery would matter more than a brief price bounce.
The above is market analysis and does not constitute investment advice.
$ETH $ADA $BERA
#EthStakingExitQueueHits2026High #FedOctoberHoldOdds82.3% #Nikkei225Jumps2.5%ToThreeMonthHigh #DriftHackVictimsBeginClaims
SoverignLedger
·
--
Evernorth XRP Treasury Completes SPAC Merger
#evernorthxrptreasurycompletesspacmerger
TLDR
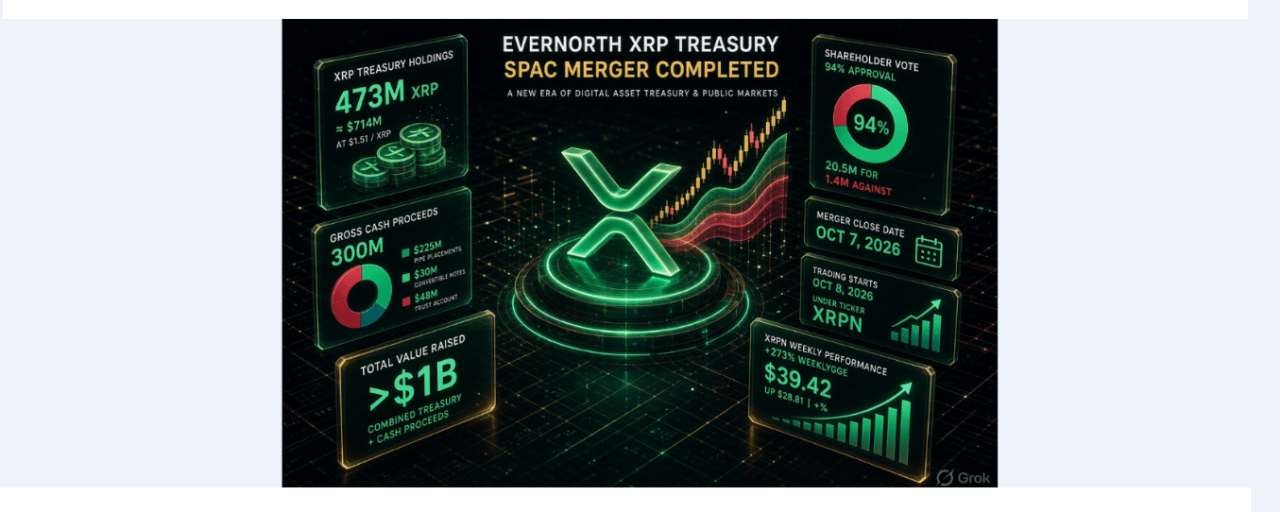
The merger is approved, but it is not yet confirmed as completed as of 2026-10-06.
The direct impact is mainly an XRP-specific institutional-access and treasury narrative; broad crypto and traditional-market effects are likely limited unless the listed vehicle attracts sustained capital.
Authenticity check
The hashtag
#EvernorthXRPTreasuryCompletesSPACMerger is premature as written. Armada Acquisition Corp. II shareholders approved the Evernorth business combination on 2026-09-30. The companies said closing is expected on 2026-10-07, subject to remaining closing conditions, with Nasdaq trading under XRPN expected to begin on 2026-10-08. Use “approved” or “nears completion” until a formal closing announcement is released. Nasdaq and the company announcement reported expected gross cash proceeds of about $300M before expenses, plus in-kind XRP contributions; Evernorth expects to hold about 473M XRP at closing.
Exchange-post note
Suggested headline:
Evernorth XRP Treasury SPAC Merger Approved; Closing Expected October 7
Post copy:
Armada Acquisition Corp. II shareholders have approved the proposed business combination with Evernorth Holdings, advancing the XRP-focused treasury company toward a planned Nasdaq debut.
The transaction is expected to close on October 7, 2026, subject to remaining conditions. If completed, Evernorth expects to hold approximately 473 million XRP and receive about $300 million in gross cash proceeds before transaction expenses. Nasdaq trading under the ticker XRPN is expected to begin on October 8, 2026.
Market context: The development could expand public-equity access to XRP-related exposure, but XRPN shares would represent ownership in a corporate treasury company—not direct ownership of XRP. Final treasury size, SPAC redemptions, transaction expenses, and actual post-listing liquidity remain key variables.
Potential crypto-market effect
First-order: XRP-specific sentiment and structure. A listed XRP treasury vehicle can give some traditional-equity investors a route to XRP-related exposure through a Nasdaq stock. This may strengthen the institutional-access narrative around XRP, particularly if the company discloses transparent custody, treasury reporting, and capital deployment after closing.
Spot-market impact is not automatic. Much of the projected 473M XRP includes in-kind contributions rather than necessarily new open-market purchases. Therefore, the headline alone does not prove equivalent immediate spot buying pressure. The actual effect depends on whether Evernorth later raises capital and deploys it into additional XRP purchases, and on the size of any investor redemptions or post-merger share issuance.
Current XRP context: XRP is trading around $1.4986 on Binance Spot, down roughly -1.7% from its 24-hour open of $1.5248; the session high and low are $1.5266 and $1.4860. That shows the approval headline has not translated into a clear broad-based upside move in the latest session.
Traditional-market effect
For traditional markets, this is more likely a niche SPAC/digital-asset-treasury event than a market-wide catalyst. Its nearest comparison is the growing class of listed companies whose equity value is heavily influenced by crypto treasury holdings.
Key transmission path:
Nasdaq listing → equity-investor access → potential capital raising → possible future XRP treasury expansion.
The largest immediate traditional-market sensitivity is likely in XRPN’s own trading, not broad equity indices. CoinDesk reported that the SPAC shell’s shares surged sharply before the merger and that significant trust redemptions could reduce the public float. A smaller float can amplify volatility, so XRPN’s equity performance may diverge substantially from XRP’s spot performance.
Bottom line: This is a meaningful XRP ecosystem and market-structure development, but not yet evidence of a completed merger or of guaranteed new XRP spot demand. The highest-value confirmation will be the official closing notice, final XRP treasury figure, capital-raise details, and XRPN’s first days of trading.
Which Crypt Coins are Affected By The This Merger?
The directly affected coin is XRP. The proposed Evernorth–Armada II transaction is built around an XRP corporate treasury: at closing, Evernorth expects to hold about 473 million XRP and list under XRPN, subject to remaining closing conditions. That creates a new public-equity vehicle whose valuation and future capital-raising capacity may be tied closely to XRP and the XRP ecosystem.
Coins most affected
XRP — direct impactA) This is the core asset held by the treasury.
B) The event can influence XRP-related sentiment, institutional-access narratives, and attention from equity investors.
C) It does not automatically mean new immediate spot-market buying, because part of the proposed treasury consists of in-kind XRP contributions and previously arranged funding rather than necessarily fresh market purchases.
XRPL ecosystem tokens — indirect, conditional impact
Tokens and projects built on the XRP Ledger could receive more market attention if Evernorth deploys capital into XRPL liquidity or infrastructure, as the company has described an actively managed XRP treasury approach.
This is a second-order effect, not a confirmed capital allocation to any specific token. The relevant condition is disclosure of actual treasury deployment, partnerships, or ecosystem investments after closing. Digital-asset-treasury narrative assets — sentiment spillover
Coins associated with other listed crypto-treasury strategies may see a thematic, rather than fundamental, read-through. Investors may compare the market’s reception of an XRP-focused treasury company with similar public-market structures centered on other crypto assets.
This is primarily an equity-market and narrative effect; it does not create a direct link to the token economics of those coins.
Coins with limited direct impact
BTC and ETH: no direct treasury connection. They may only be affected if the listing improves or weakens overall appetite for publicly traded crypto-treasury companies.
SOL, BNB, DOGE, ADA, AVAX, LINK and most other major assets: no direct connection to Evernorth’s stated XRP-focused treasury. Any movement would likely reflect wider crypto risk sentiment, not this deal itself.
What to watch
The more meaningful confirmation points are the formal merger closing, the final XRP amount held, post-redemption public float, and whether Evernorth announces new XRP purchases or XRPL ecosystem deployments. Share volatility in the SPAC vehicle has already been elevated ahead of the expected merger, so XRPN equity volatility should not be treated as a one-for-one signal for XRP’s spot price.
Note:-The above is market analysis and does not constitute investment advice
$XRP $XRPN.US $BTC
#BinanceLaunchesBinanceIntelligence #ADAGains10%Above$0.27 #ETHUp70%InQ3ButLiquidityFalls #FedOctoberHoldOdds82.3%
Click here for Article "ADA Gains Above 0.27 Dollar"
SoverignLedger
·
--
Strive Buys 2000 BTC For 169M Dollar
#StriveBuys2000BTCFor$169M
Full Beakdown, Technicals, Market Impact & Forward View
Exact Deal Details
Buyer: Strive, Inc. (Nasdaq: ASST / preferred SATA) – Bitcoin treasury company co-founded by Vivek Ramaswamy; CEO Matt Cole. Purchase: 2,000 BTC Period: September 28 – October 2, 2026 Total cost: ~$169 million Average price: $84,422 per BTC (including fees & expenses) New total holdings: 29,462 BTC (as of Oct 2) Funding mix: 61.5% from SATA preferred stock sales; warrants generated $56.7 million. Company stance: Debt-free, $284.7 million cash (as of Sept 30), views BTC as “attractively priced” under $100k; targeting amplification ratio >60%. Context: Largest weekly buy since the 2,500 BTC purchase (May 23–June 1). Q3 total: +8,137 BTC at avg $78,885. Average cost basis across stack ~$90,170–$90,700. Holdings value ~$2.5–2.55 billion at ~$85–86k BTC. Trailing MARA by ~6,115 BTC (MARA ~35,577).
This is pure corporate treasury accumulation via equity/preferred issuance — classic “raise capital → buy BTC → boost BTC-per-share” model.
Link to Hormuz or World Incidents?
None. The buy window (Sept 28–Oct 2) overlapped with elevated Strait of Hormuz / Iran-related oil and risk-off pressure (Trump rejection of Iran ceasefire proposal kept crude elevated and briefly pushed BTC toward the low-$83k area). However, Strive’s 8-K, Cole’s posts, and all major coverage treat this strictly as opportunistic treasury buying at discounted levels. No geopolitical, oil, or macro-event motivation is cited. BTC simply looked cheap relative to their long-term thesis.
Technical Analysis Snapshot (BTC as of early Oct 6, 2026)
Spot: hovering ~$85,000–$86,000 range (recent daily closes ~$85.3k–$85.7k; recent high near $87.2k on Oct 2). Purchase zone ($84.4k) sat near short-term support after the late-September Hormuz-driven dip. Structure: Price consolidating after reclaiming higher levels from the mid-$80k zone. Key near-term levels: support $82k–$83.5k / $81.6k zone; resistance $86.5k–$87.2k then $88k+. Broader context: Institutional treasury buying continues to absorb supply even when retail/risk assets pause. Corporate stacks (Strategy, Metaplanet, MARA, Strive, etc.) act as structural demand.
Effects on the Crypto Market
Immediate: Limited price impact — 2,000 BTC is meaningful for a single corporate wallet but small vs daily global volume. BTC stayed relatively flat around the announcement. ASST stock reacted positively (+1–2%+ on the day). Structural: Reinforces the corporate Bitcoin treasury narrative. Removes coins from liquid supply into long-term corporate balance sheets. Narrows the gap to other top public holders and keeps competitive pressure on accumulation strategies. **Sentiment **: Bullish signal for institutional conviction during geopolitical noise. Shows capital markets (preferred stock + warrants) remain open for BTC-treasury vehicles. Supports the “supply shock” thesis as more public companies treat BTC as primary treasury reserve. Broader crypto: Positive halo for BTC dominance and related equities/miners; limited direct spillover to alts unless risk appetite expands.
Foresight / Visionary Outlook
Strive’s model (debt-free, SATA-funded, amplification targeting >60% while BTC <$100k) is designed for sustained weekly/monthly buys. Expect continued accumulation as long as capital markets stay receptive. If more corporates follow (or existing ones accelerate), the cumulative effect tightens liquid supply — historically supportive for higher prices over multi-quarter horizons. Near-term: BTC needs to hold $82–83k support and reclaim $87–88k convincingly for momentum. Macro (rates, oil/Hormuz resolution, fiscal policy) remains the swing factor. Medium-term visionary: Corporate treasuries are becoming a permanent bid. Strive’s rapid rise into the top public holders illustrates how quickly the landscape can shift. Long-term holders who view BTC as digital hard money will see these buys as validation of the scarcity + institutional adoption thesis.
Bottom line: Clean, opportunistic $169M treasury add at ~$84.4k. No Hormuz link. Pure accumulation signal. Watch ASST/SATA for capital-raise cadence and BTC for whether $85k+ becomes the new floor.
Sources: Strive SEC 8-K (Oct 5, 2026), Matt Cole (@ColeMacro ) disclosure, Decrypt, The Block, CryptoTimes, Bitbo, and concurrent market data.
👉 Evernorth XRP Treasury Completes SPAC Merger
$BTC $NVDAB $AAPLB
#BinanceLaunchesBinanceIntelligence #DriftHackVictimsBeginClaims #CircleMints$2.75BUSDCOnSolanaIn7Days #Nikkei225Jumps2.5%ToThreeMonthHigh
Votre contenu coté a été supprimé
Connectez-vous pour découvrir plus de contenu