Binance Square

TiTanicDoge

Binance Lover 💞 $BTC $Doge $PePe
Ouvert au trading
Détenteur pour DOGE
Détenteur pour DOGE
Trade régulièrement
4.5 an(s)
4.1K+ Suivis
481 Abonnés
13 J’aime
Publications
Portefeuille
·
--
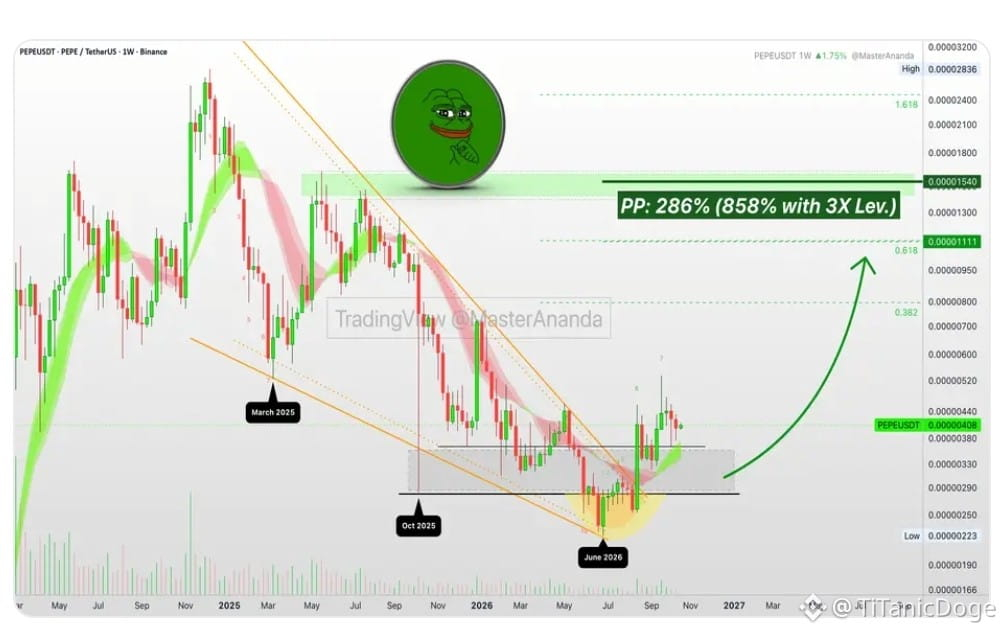
$PEPE The current price of Pepe coin ($PEPE) is trading at approximately $0.0000044 USD, showing short-term resilience with an 8.3% increase over the last seven days. Despite broader crypto market uncertainty and rising global macroeconomic risks, $PEPE has managed to outpace older meme coins like Dogecoin and Shiba Inu over the past week due to localized whale accumulation and reduced liquid supply on exchanges. Key Technical Levels & Catalyst Analysis • Immediate Resistance: $0.0000045 to $0.0000046. Breaking past this zone is required to validate a stronger short-term rally. • Crucial Support: $0.0000039. A drop below this floor invalidates the current bullish structure and triggers a deeper pullback. • Market Sentiment: Currently neutral (Fear & Greed Index at 54). Retail momentum remains highly speculative and volatile. • Hidden Mechanics: Large-scale whale withdrawals off centralized exchanges (such as a recent $20M movement) have thinned out immediate sell-side order books, leaving the asset primed for quick price spikes if buying volume returns. {spot}(PEPEUSDT)
$PEPE
The current price of Pepe coin ($PEPE ) is trading at approximately $0.0000044 USD, showing short-term resilience with an 8.3% increase over the last seven days. Despite broader crypto market uncertainty and rising global macroeconomic risks, $PEPE has managed to outpace older meme coins like Dogecoin and Shiba Inu over the past week due to localized whale accumulation and reduced liquid supply on exchanges.

Key Technical Levels & Catalyst Analysis

• Immediate Resistance: $0.0000045 to $0.0000046. Breaking past this zone is required to validate a stronger short-term rally.
• Crucial Support: $0.0000039. A drop below this floor invalidates the current bullish structure and triggers a deeper pullback.
• Market Sentiment: Currently neutral (Fear & Greed Index at 54). Retail momentum remains highly speculative and volatile.
• Hidden Mechanics: Large-scale whale withdrawals off centralized exchanges (such as a recent $20M movement) have thinned out immediate sell-side order books, leaving the asset primed for quick price spikes if buying volume returns.
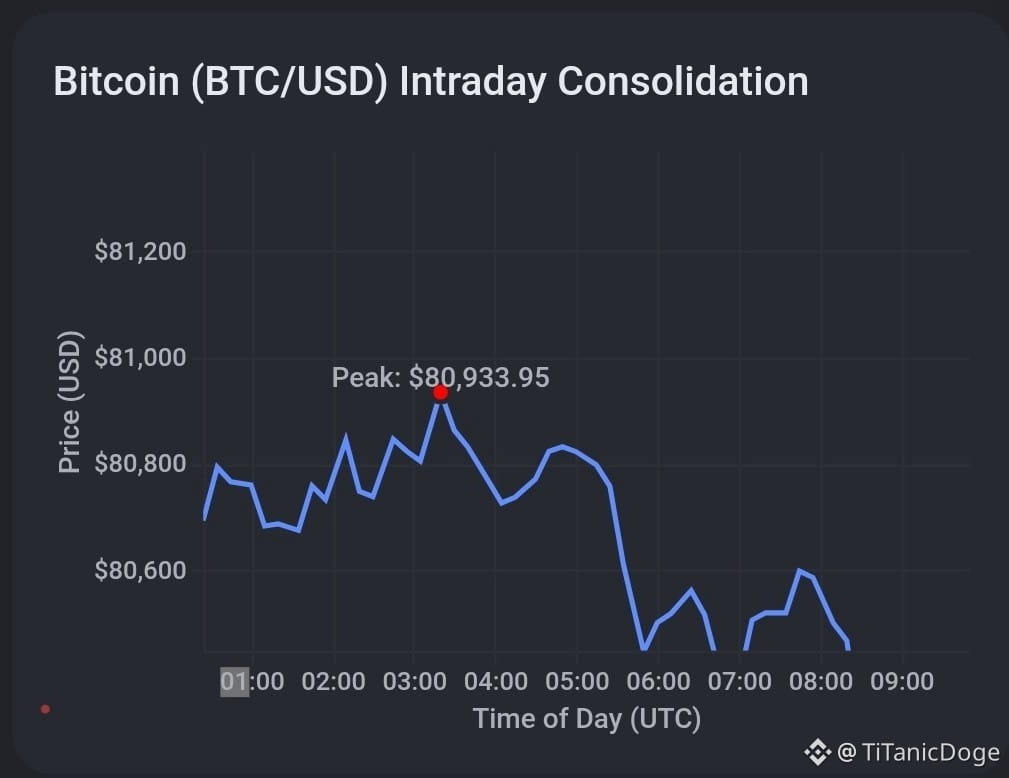
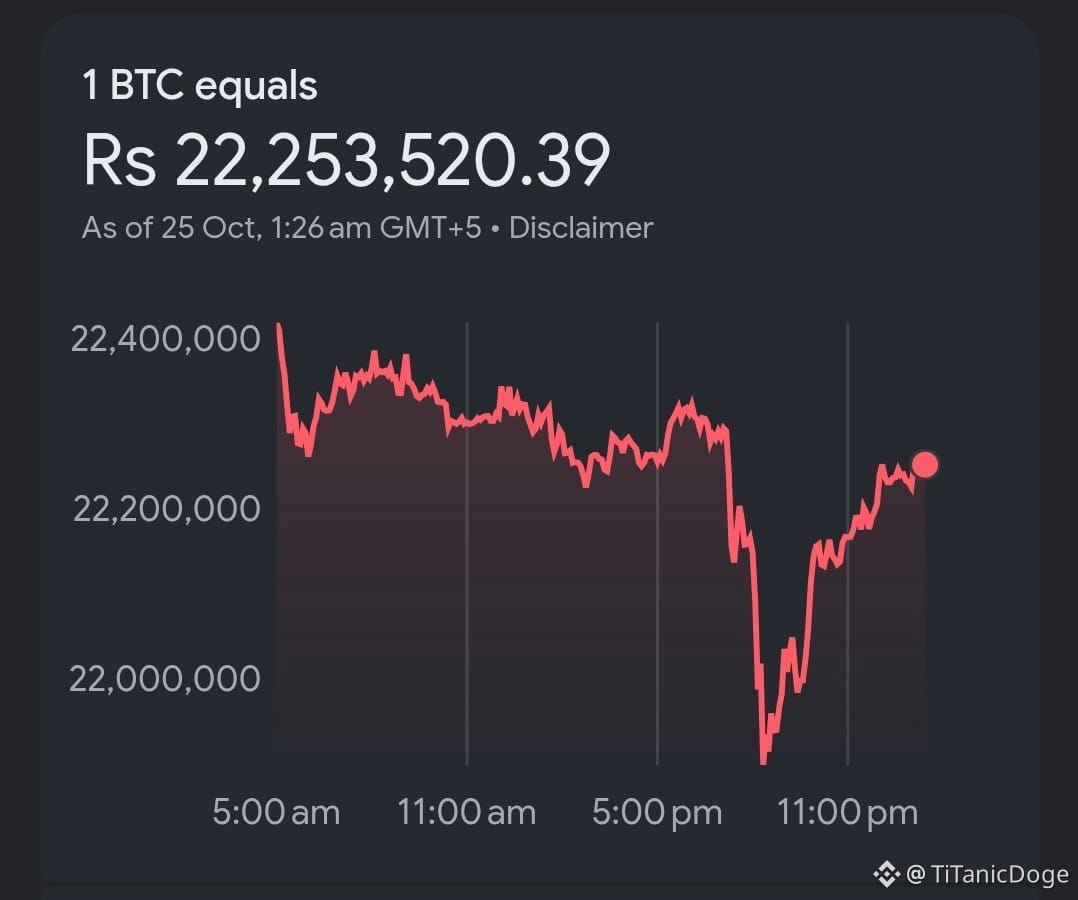
$BTC Bitcoin (BTC) is trading near the $80,000 psychological threshold, down roughly 0.5% over the past 24 hours. Selling pressure has intensified recently due to macro-driven tech stock pullbacks and shifts in Fed interest rate expectations. {spot}(BTCUSDT)
$BTC
Bitcoin (BTC) is trading near the $80,000 psychological threshold, down roughly 0.5% over the past 24 hours. Selling pressure has intensified recently due to macro-driven tech stock pullbacks and shifts in Fed interest rate expectations.
$ETH Ethereum is currently trading at approximately $2,327, down about 13.2% for the month of October 2026. The market is experiencing short-term bearish momentum as the asset retests key long-term moving averages. This recent downward pressure stems from a mix of technical breakdowns, substantial institutional outflows from U.S. spot ETFs, and delays in the network's upgrade roadmap. #ETHETFS #Ethereum✅ #AnthropicS1ExpectedToday {spot}(ETHUSDT)
$ETH
Ethereum is currently trading at approximately $2,327, down about 13.2% for the month of October 2026. The market is experiencing short-term bearish momentum as the asset retests key long-term moving averages.
This recent downward pressure stems from a mix of technical breakdowns, substantial institutional outflows from U.S. spot ETFs, and delays in the network's upgrade roadmap.
#ETHETFS
#Ethereum✅
#AnthropicS1ExpectedToday
Reading Binance need help you a lot in trading,,
Binance News
·
--
Bitcoin Wallet Bug Let Rogue Servers Steal Funds When Users Tried to Speed Up Payments
Electrum’s wallet flaw let malicious servers replace pending Bitcoin transactions with fake payments that users could authorize to attackers when raising fees through Replace-by-Fee; developers confirmed at least one theft. Electrum disclosed the vulnerability on Saturday, according to CoinDesk, and released version 4.8.3 on Oct. 24 to check signatures on unconfirmed transactions. Earlier versions remain vulnerable when connected to malicious servers, whose identities and the amount stolen have not been disclosed. Developers recommend upgrading and verifying addresses and amounts before signing; users connected only to trusted servers, including their own, were not exposed.
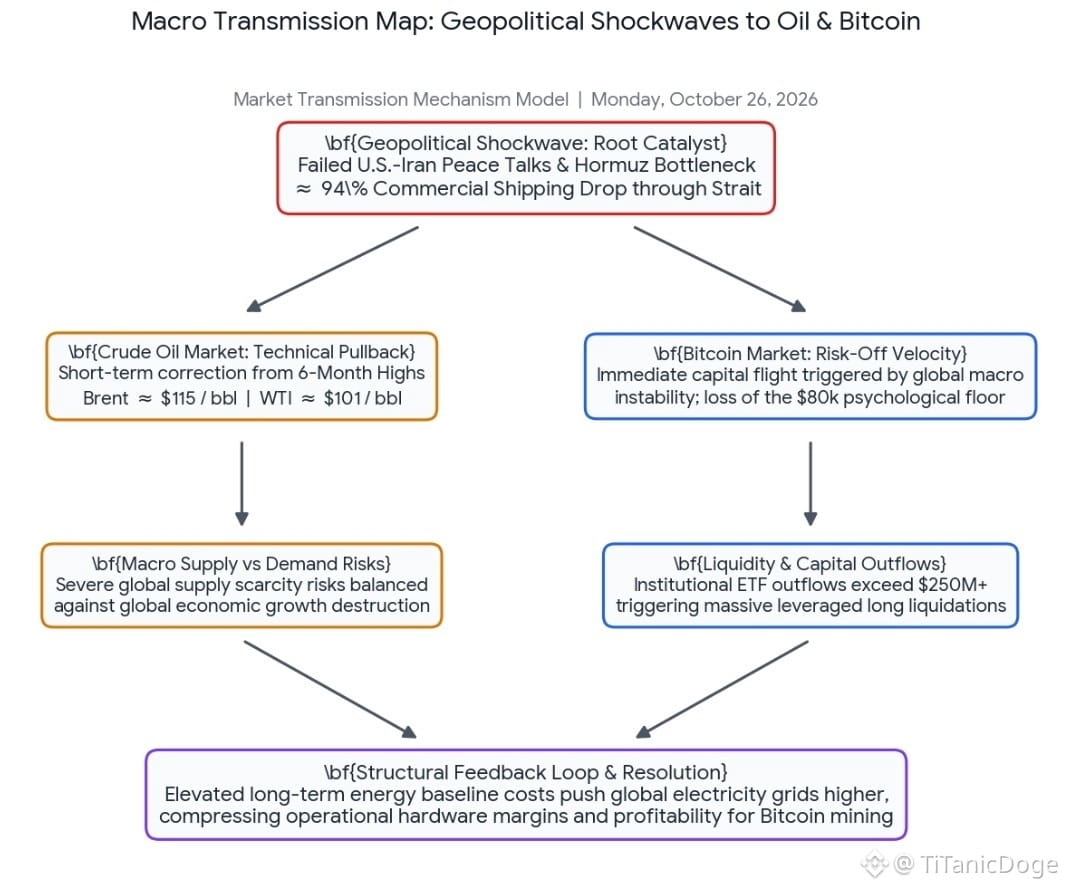
$BTC Global macro markets today are heavily impacted by failing U.S.–Iran peace talks. Both Bitcoin and Crude Oil are showing pullbacks from recent key levels as investors digest geopolitical headlines and position themselves defensively ahead of the upcoming Federal Reserve FOMC meeting. #TrendingPredictions #TrendingInvestments {spot}(BTCUSDT)
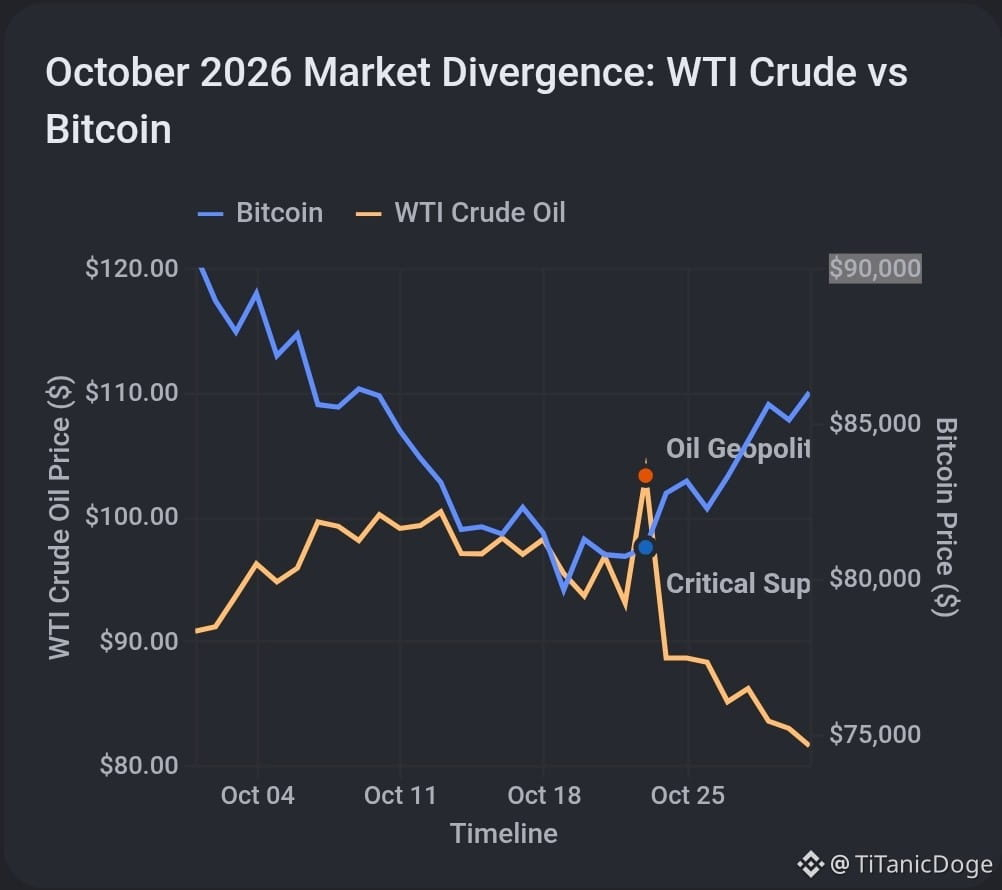
$BTC Global macro markets today are heavily impacted by failing U.S.–Iran peace talks. Both Bitcoin and Crude Oil are showing pullbacks from recent key levels as investors digest geopolitical headlines and position themselves defensively ahead of the upcoming Federal Reserve FOMC meeting.

#TrendingPredictions
#TrendingInvestments
$BTC The Bull Trap Still Exists (The Bearish View) Analysts warning of a bull trap point to a structural "trap door" and over-extended leverage: • The Headwind Block ($87,700): According to on-chain data from Glassnode, recent buyers have an average cost basis of $87,700. Bitcoin has repeatedly hit a wall just below this level (peaking around $87,300 in late September and October) and failed. This creates intense selling pressure as underwater buyers look to exit at break-even. • Overheated Derivatives: Funding rates and leverage remain dangerously high. If Bitcoin breaks below critical floors, it could trigger a massive long-liquidation cascade. • Macroeconomic Pressure: The Federal Reserve's sudden move to tighten and raise interest rates to the 3.75%–4.00% range has restricted global liquidity growth, keeping a lid on speculative assets The Bull Trap is Over / Invalidated (The Bullish View) Proponents of a structural breakout argue the market has built a powerful institutional floor: • The Corporate Floor ($80,000): Public treasuries hold approximately 1.3 million BTC at an average cost of $80,000. Combined with a massive wave of Spot Bitcoin ETF inflows (pulling in over half a billion dollars in a single recent session), this level serves as strong buying support. • MVRV Momentum Reset: The Market Value to Realized Value (MVRV) momentum oscillator crossed into the green, suggesting a recovery from the shallow 2026 consolidation phase and signaling a standard accumulation cycle. • Historical Cycles: Long-term bulls point to institutional demand and power law models to project eventual end-of-year extensions toward the $90,000–$100,000 zone. #BTC🔥🔥🔥🔥🔥 #btc70k {spot}(BTCUSDT)
$BTC

The Bull Trap Still Exists (The Bearish View)

Analysts warning of a bull trap point to a structural "trap door" and over-extended leverage:
• The Headwind Block ($87,700): According to on-chain data from Glassnode, recent buyers have an average cost basis of $87,700. Bitcoin has repeatedly hit a wall just below this level (peaking around $87,300 in late September and October) and failed. This creates intense selling pressure as underwater buyers look to exit at break-even.
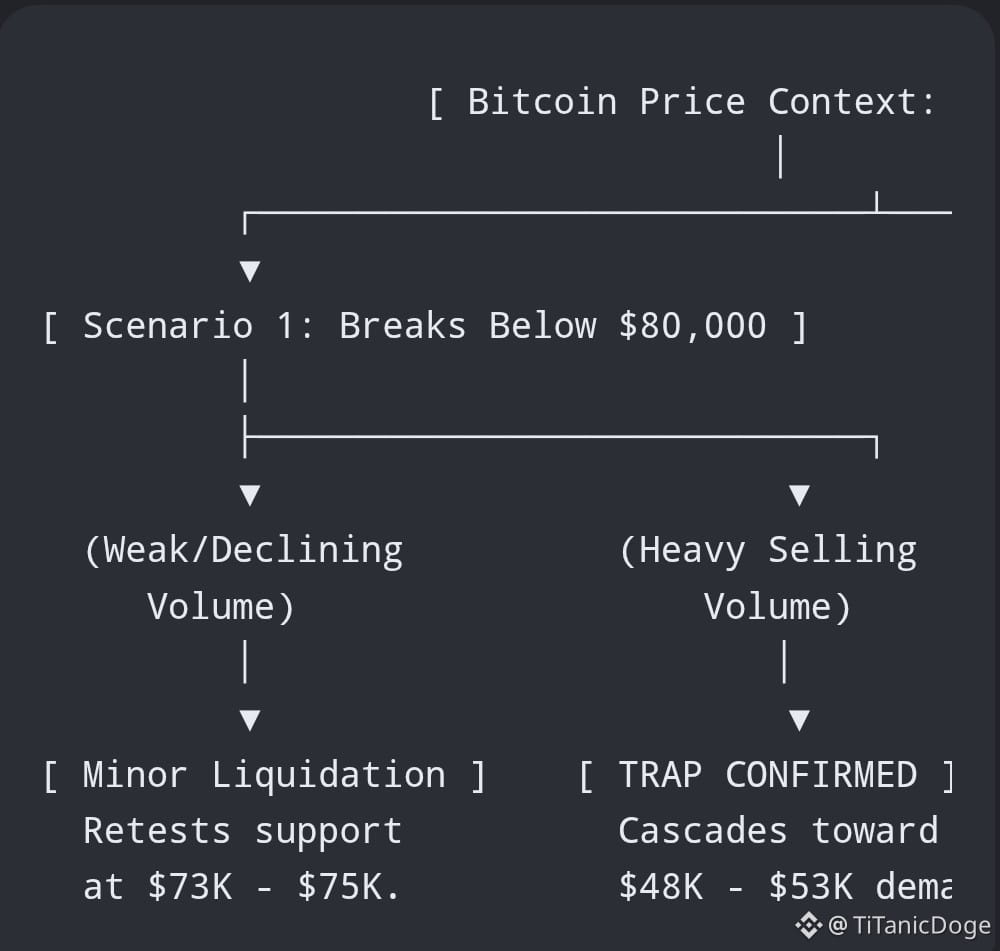
• Overheated Derivatives: Funding rates and leverage remain dangerously high. If Bitcoin breaks below critical floors, it could trigger a massive long-liquidation cascade.
• Macroeconomic Pressure: The Federal Reserve's sudden move to tighten and raise interest rates to the 3.75%–4.00% range has restricted global liquidity growth, keeping a lid on speculative assets

The Bull Trap is Over / Invalidated (The Bullish View)

Proponents of a structural breakout argue the market has built a powerful institutional floor:
• The Corporate Floor ($80,000): Public treasuries hold approximately 1.3 million BTC at an average cost of $80,000. Combined with a massive wave of Spot Bitcoin ETF inflows (pulling in over half a billion dollars in a single recent session), this level serves as strong buying support.
• MVRV Momentum Reset: The Market Value to Realized Value (MVRV) momentum oscillator crossed into the green, suggesting a recovery from the shallow 2026 consolidation phase and signaling a standard accumulation cycle.
• Historical Cycles: Long-term bulls point to institutional demand and power law models to project eventual end-of-year extensions toward the $90,000–$100,000 zone.

#BTC🔥🔥🔥🔥🔥
#btc70k
·
--
Haussier
🚨Oil Prices and Bitcoin Macro Market Overview & Weekly Analysis 🛢️ Crude Oil: Bullish Catalysts & Supply Constraints • Geopolitical Premium: Oil prices have rallied sharply, with WTI crude settling at $103.27 per barrel and Brent climbing past $109.30. Escalating tensions in the Middle East—specifically Houthi strikes on commercial shipping vessels and energy infrastructure—have injected a substantial risk premium into the energy markets. • Inventory & Demand Outlook: Despite conflicting signals like a recovering flow through the Persian Gulf, falling U.S. crude inventories are keeping the structural market tight. • Technical / Trend Outlook: The market enters the week following a strong multi-day win streak. Analysts target critical resistance at $105, above which doors open to $108 and $110. The Energy Information Administration (EIA) has upwardly revised its Q4 forecasts to average around $105 for Brent, reinforcing a "higher for longer" structural environment. ₿ Bitcoin: Macro Headwinds & Volatility • Liquidity Squeeze: Bitcoin (BTC) ends the week vulnerable, trading at roughly $81,000. The market is absorbing structural shocks from a broader sell-off triggered by China market instability and robust U.S. jobs data that signals the Federal Reserve may remain hawkish. • The Energy Correlation: Mechanically, surging oil prices translate to higher global electricity costs, elevating the underlying mining operational expenses for the Bitcoin network. Historically, this pressure weighs on miner margins and can compress short-term spot returns. • Technical / Trend Outlook: BTC is testing critical macro support. It is currently locked in a strict horizontal range bounded by $80,500 on the floor and $87,400 on the ceiling. Technical indicators and major moving averages skew heavily toward a short-term "Sell". If the key structural floor at $80,500 fails to hold, traders are widely anticipating a deeper retracement toward the $76,000 liquidity pool. #OilPrice #BTC🔥🔥🔥🔥🔥 {future}(BTCUSDT)
🚨Oil Prices and Bitcoin

Macro Market Overview & Weekly Analysis
🛢️ Crude Oil: Bullish Catalysts & Supply Constraints
• Geopolitical Premium: Oil prices have rallied sharply, with WTI crude settling at $103.27 per barrel and Brent climbing past $109.30. Escalating tensions in the Middle East—specifically Houthi strikes on commercial shipping vessels and energy infrastructure—have injected a substantial risk premium into the energy markets.
• Inventory & Demand Outlook: Despite conflicting signals like a recovering flow through the Persian Gulf, falling U.S. crude inventories are keeping the structural market tight.
• Technical / Trend Outlook: The market enters the week following a strong multi-day win streak. Analysts target critical resistance at $105, above which doors open to $108 and $110. The Energy Information Administration (EIA) has upwardly revised its Q4 forecasts to average around $105 for Brent, reinforcing a "higher for longer" structural environment.
₿ Bitcoin: Macro Headwinds & Volatility
• Liquidity Squeeze: Bitcoin (BTC) ends the week vulnerable, trading at roughly $81,000. The market is absorbing structural shocks from a broader sell-off triggered by China market instability and robust U.S. jobs data that signals the Federal Reserve may remain hawkish.
• The Energy Correlation: Mechanically, surging oil prices translate to higher global electricity costs, elevating the underlying mining operational expenses for the Bitcoin network. Historically, this pressure weighs on miner margins and can compress short-term spot returns.
• Technical / Trend Outlook: BTC is testing critical macro support. It is currently locked in a strict horizontal range bounded by $80,500 on the floor and $87,400 on the ceiling. Technical indicators and major moving averages skew heavily toward a short-term "Sell". If the key structural floor at $80,500 fails to hold, traders are widely anticipating a deeper retracement toward the $76,000 liquidity pool.
#OilPrice
#BTC🔥🔥🔥🔥🔥
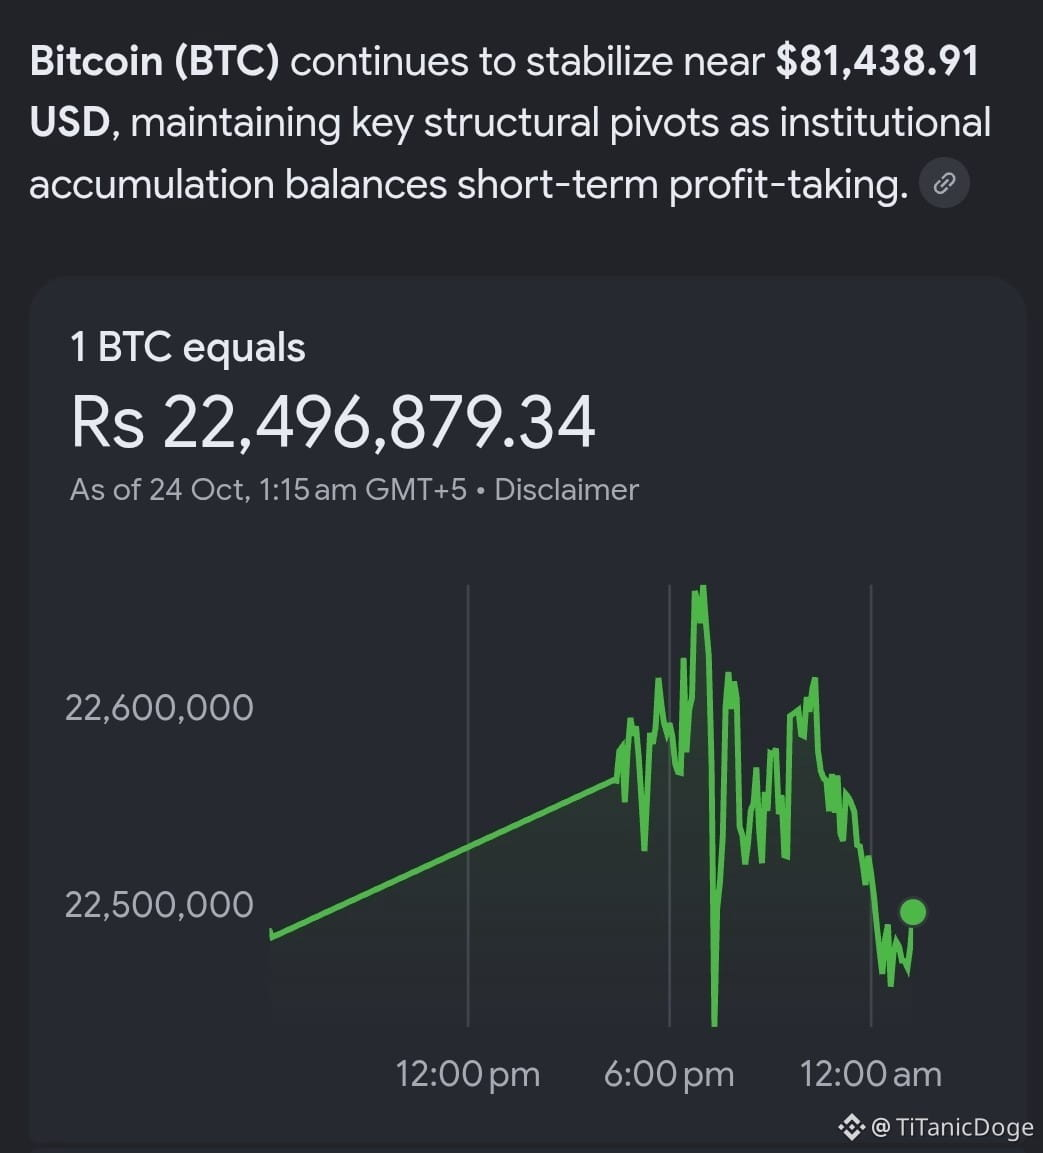
#BTC Bitcoin (BTC) is currently trading at approximately $80,272.53, experiencing a -1.23% decline over the last 24 hours. The broader weekly momentum shows a contraction of roughly 2% as the market encounters a wave of selling pressure. Heavy ETF Outflows: A massive wave of $635.6 million in net daily redemptions from U.S. spot Bitcoin ETFs has significantly muted institutional buyer support, forcing short-term liquidations. Macroeconomic Headwinds: Broader market sentiment is under pressure due to stronger-than-expected U.S. PMI data and rising crude oil prices, both of which are stoking global inflation concerns and denting risk appetite. Institutional Structural Balancing: Large corporate holders like MicroStrategy face a complex dynamic trying to balance aggressive bitcoin accumulation against paying out preferred stock dividends. #DowDrops653Points #USConsumerSentimentHoldsAtSecondLowestOnRecord #IRSPlansLowerTaxDisclosurePenaltiesForCryptoCases {future}(BTCUSDT)
#BTC
Bitcoin (BTC) is currently trading at approximately $80,272.53, experiencing a -1.23% decline over the last 24 hours. The broader weekly momentum shows a contraction of roughly 2% as the market encounters a wave of selling pressure.

Heavy ETF Outflows: A massive wave of $635.6 million in net daily redemptions from U.S. spot Bitcoin ETFs has significantly muted institutional buyer support, forcing short-term liquidations.

Macroeconomic Headwinds: Broader market sentiment is under pressure due to stronger-than-expected U.S. PMI data and rising crude oil prices, both of which are stoking global inflation concerns and denting risk appetite.

Institutional Structural Balancing: Large corporate holders like MicroStrategy face a complex dynamic trying to balance aggressive bitcoin accumulation against paying out preferred stock dividends.

#DowDrops653Points
#USConsumerSentimentHoldsAtSecondLowestOnRecord #IRSPlansLowerTaxDisclosurePenaltiesForCryptoCases
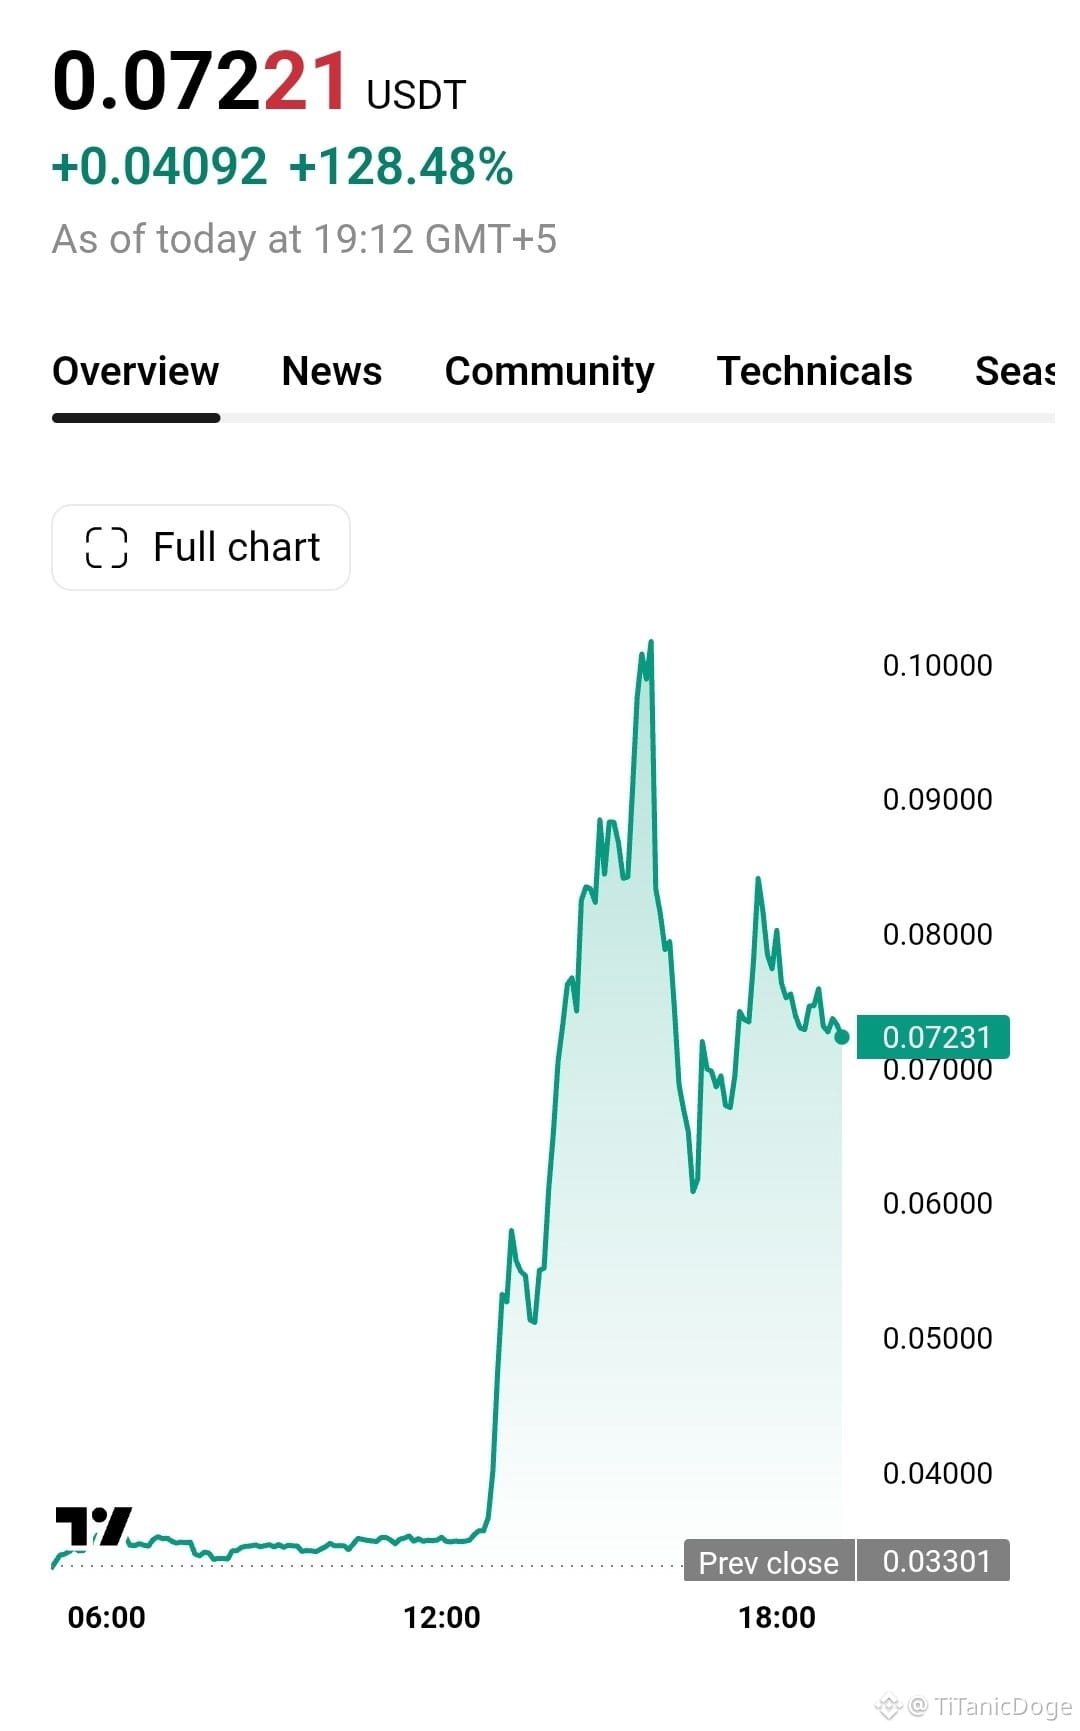
#orderusdt The current live price of Orderly Network (ORDER/USDT) sits at approximately $0.074 USDT, following a strong intraday rally of +7.32% in the last 24 hours. The token's daily market performance has triggered an aggressive surge in trading activity, with a 24-hour volume reaching over $167 million #ORDERUSDT #EarningsSeason #BinancePick {future}(ORDERUSDT)
#orderusdt
The current live price of Orderly Network (ORDER/USDT) sits at approximately $0.074 USDT, following a strong intraday rally of +7.32% in the last 24 hours. The token's daily market performance has triggered an aggressive surge in trading activity, with a 24-hour volume reaching over $167 million

#ORDERUSDT
#EarningsSeason
#BinancePick
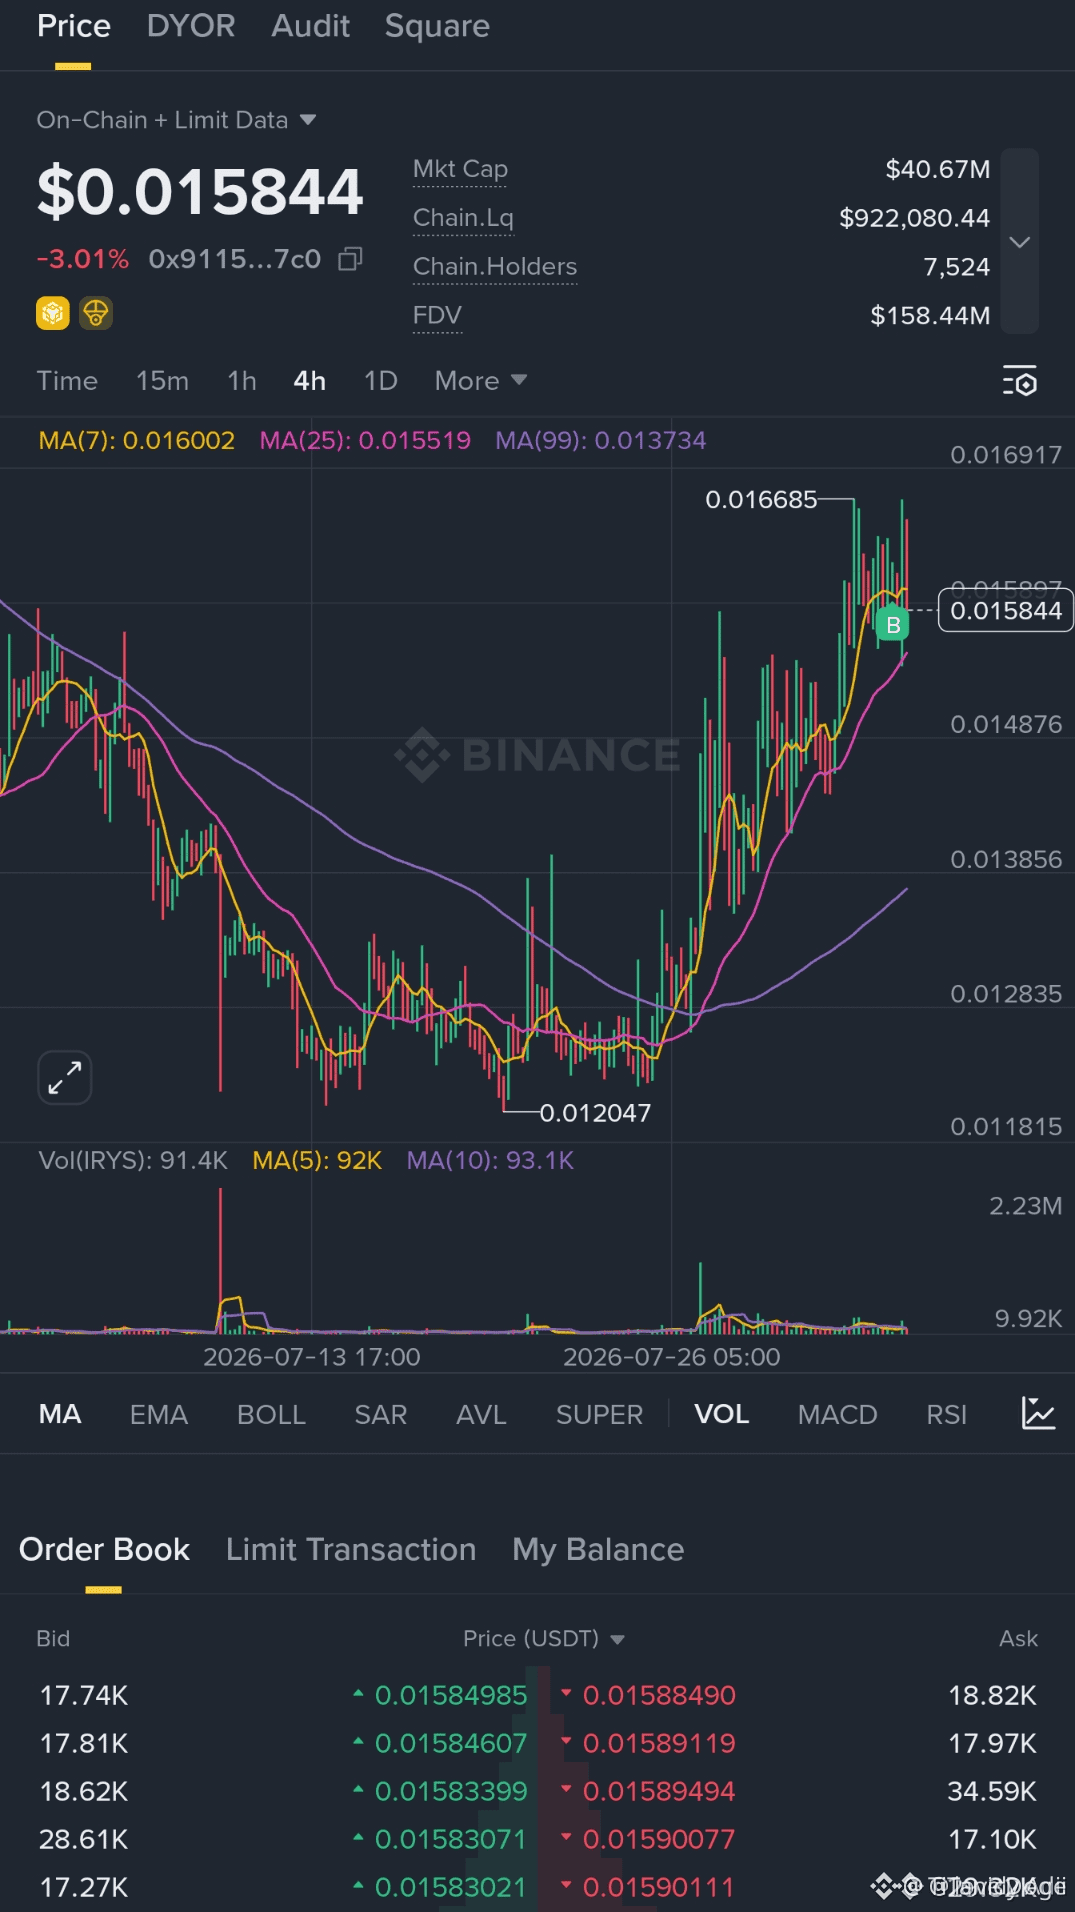
$IRYS An analysis of the cryptocurrency project Irys (IRYS)—which matches the phonetic name "IRYAS coin"—reveals a highly active Layer 1 datachain that has experienced massive market volatility. The live market statistics and tokenomics for the IRYS token are detailed below: Market Overview & Price Action • Live Price: $0.1396 USD. • 24-Hour Surge: The token has experienced a massive 561.93% rally within the last 24 hours, heavily driving it into the Top 100 cryptocurrencies by market capitalization (currently ranked #99). • Trading Volume: 24-hour trading volume has surged dramatically to $970.88 million USD, reflecting explosive speculative interest or sudden liquidity inflows across major global exchanges. • Market Capitalization: The live circulating market cap sits at $358.27 million USD. • Supply: There is a circulating supply of 2,566,813,162 IRYS, with a predefined maximum supply cap of 10 billion token #IRYSSetup #IrysToken {future}(IRYSUSDT)
$IRYS
An analysis of the cryptocurrency project Irys (IRYS)—which matches the phonetic name "IRYAS coin"—reveals a highly active Layer 1 datachain that has experienced massive market volatility.
The live market statistics and tokenomics for the IRYS token are detailed below:

Market Overview & Price Action

• Live Price: $0.1396 USD.
• 24-Hour Surge: The token has experienced a massive 561.93% rally within the last 24 hours, heavily driving it into the Top 100 cryptocurrencies by market capitalization (currently ranked #99).
• Trading Volume: 24-hour trading volume has surged dramatically to $970.88 million USD, reflecting explosive speculative interest or sudden liquidity inflows across major global exchanges.
• Market Capitalization: The live circulating market cap sits at $358.27 million USD.
• Supply: There is a circulating supply of 2,566,813,162 IRYS, with a predefined maximum supply cap of 10 billion token
#IRYSSetup
#IrysToken
$PEPE The current price of PEPE (Pepe Coin) is approximately $0.0000044 to $0.0000046, with a total market capitalization near $1.8 billion. Key Market Metrics • Price Range: Trading around $0.0000044 – $0.0000046 USD. • Market Capitalization: Approximately $1.8B – $1.85B. • 24-Hour Trading Volume: High volatility with active spot and derivatives turnover (hundreds of millions of dollars). • All-Time High: Reached $0.00002836 on December 8, 2024, trading significantly lower (over 80%) below that peak. Short-Term Momentum: PEPE has seen intermittent speculative bounces and short-term relief rallies tied to broader meme coin sector rotation (which accounts for a large slice of total meme market capitalization). #EarningsSeason #BinancePick #PepeJumps14%ToLeadAltcoinRebound
$PEPE
The current price of PEPE (Pepe Coin) is approximately $0.0000044 to $0.0000046, with a total market capitalization near $1.8 billion.

Key Market Metrics

• Price Range: Trading around $0.0000044 – $0.0000046 USD.
• Market Capitalization: Approximately $1.8B – $1.85B.
• 24-Hour Trading Volume: High volatility with active spot and derivatives turnover (hundreds of millions of dollars).
• All-Time High: Reached $0.00002836 on December 8, 2024, trading significantly lower (over 80%) below that peak.
Short-Term Momentum: PEPE has seen intermittent speculative bounces and short-term relief rallies tied to broader meme coin sector rotation (which accounts for a large slice of total meme market capitalization).

#EarningsSeason
#BinancePick
#PepeJumps14%ToLeadAltcoinRebound
Follow ,,, Learn and earn 😊
Sonum_Sohail
·
--
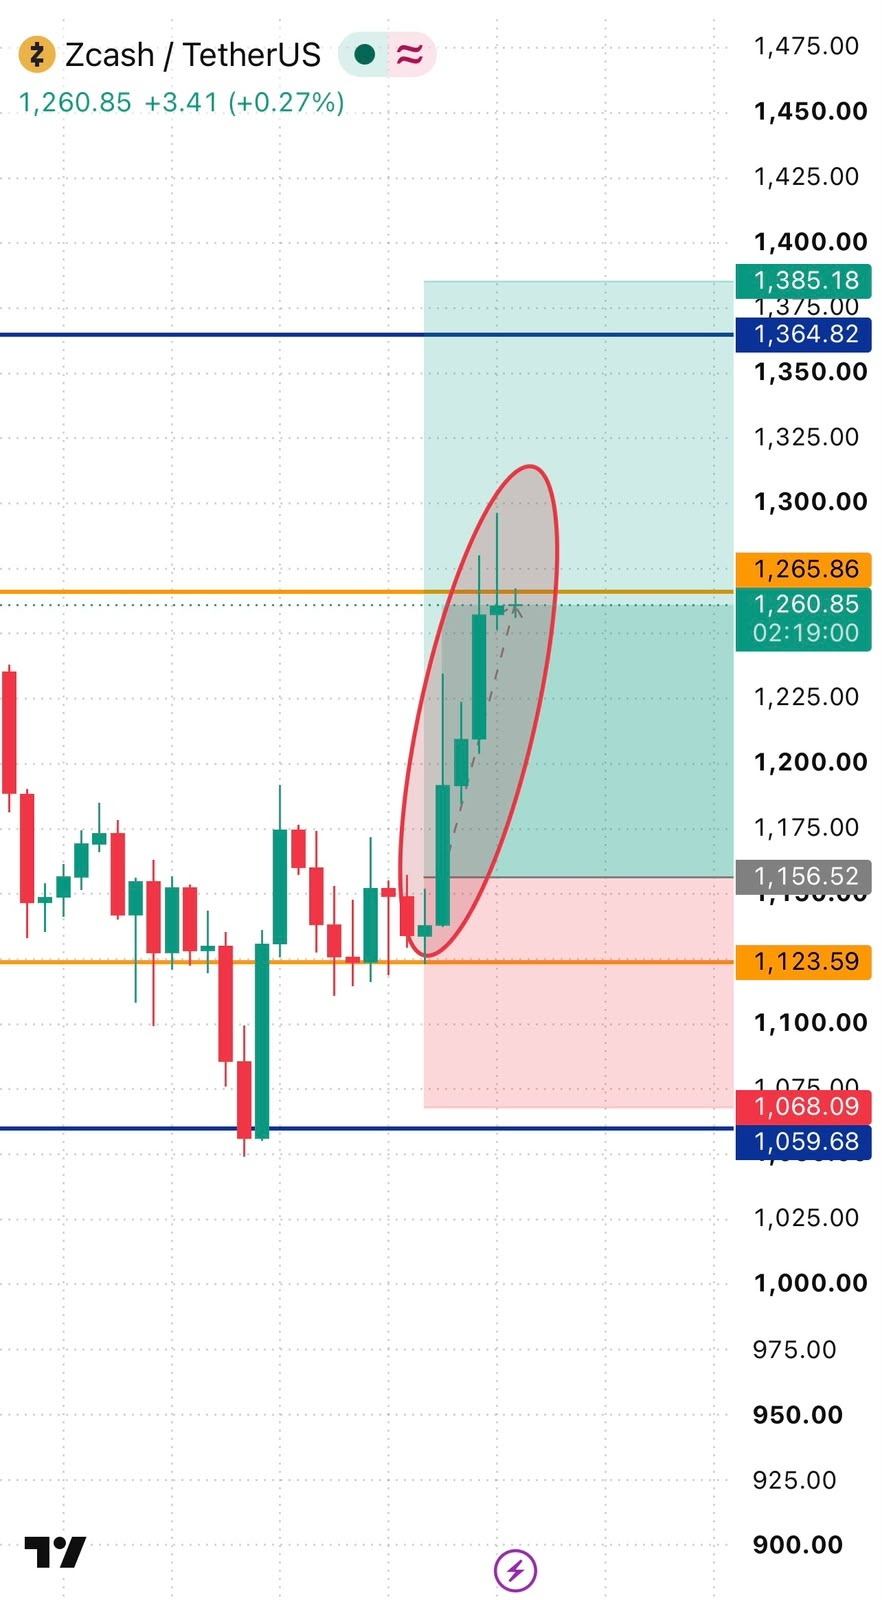
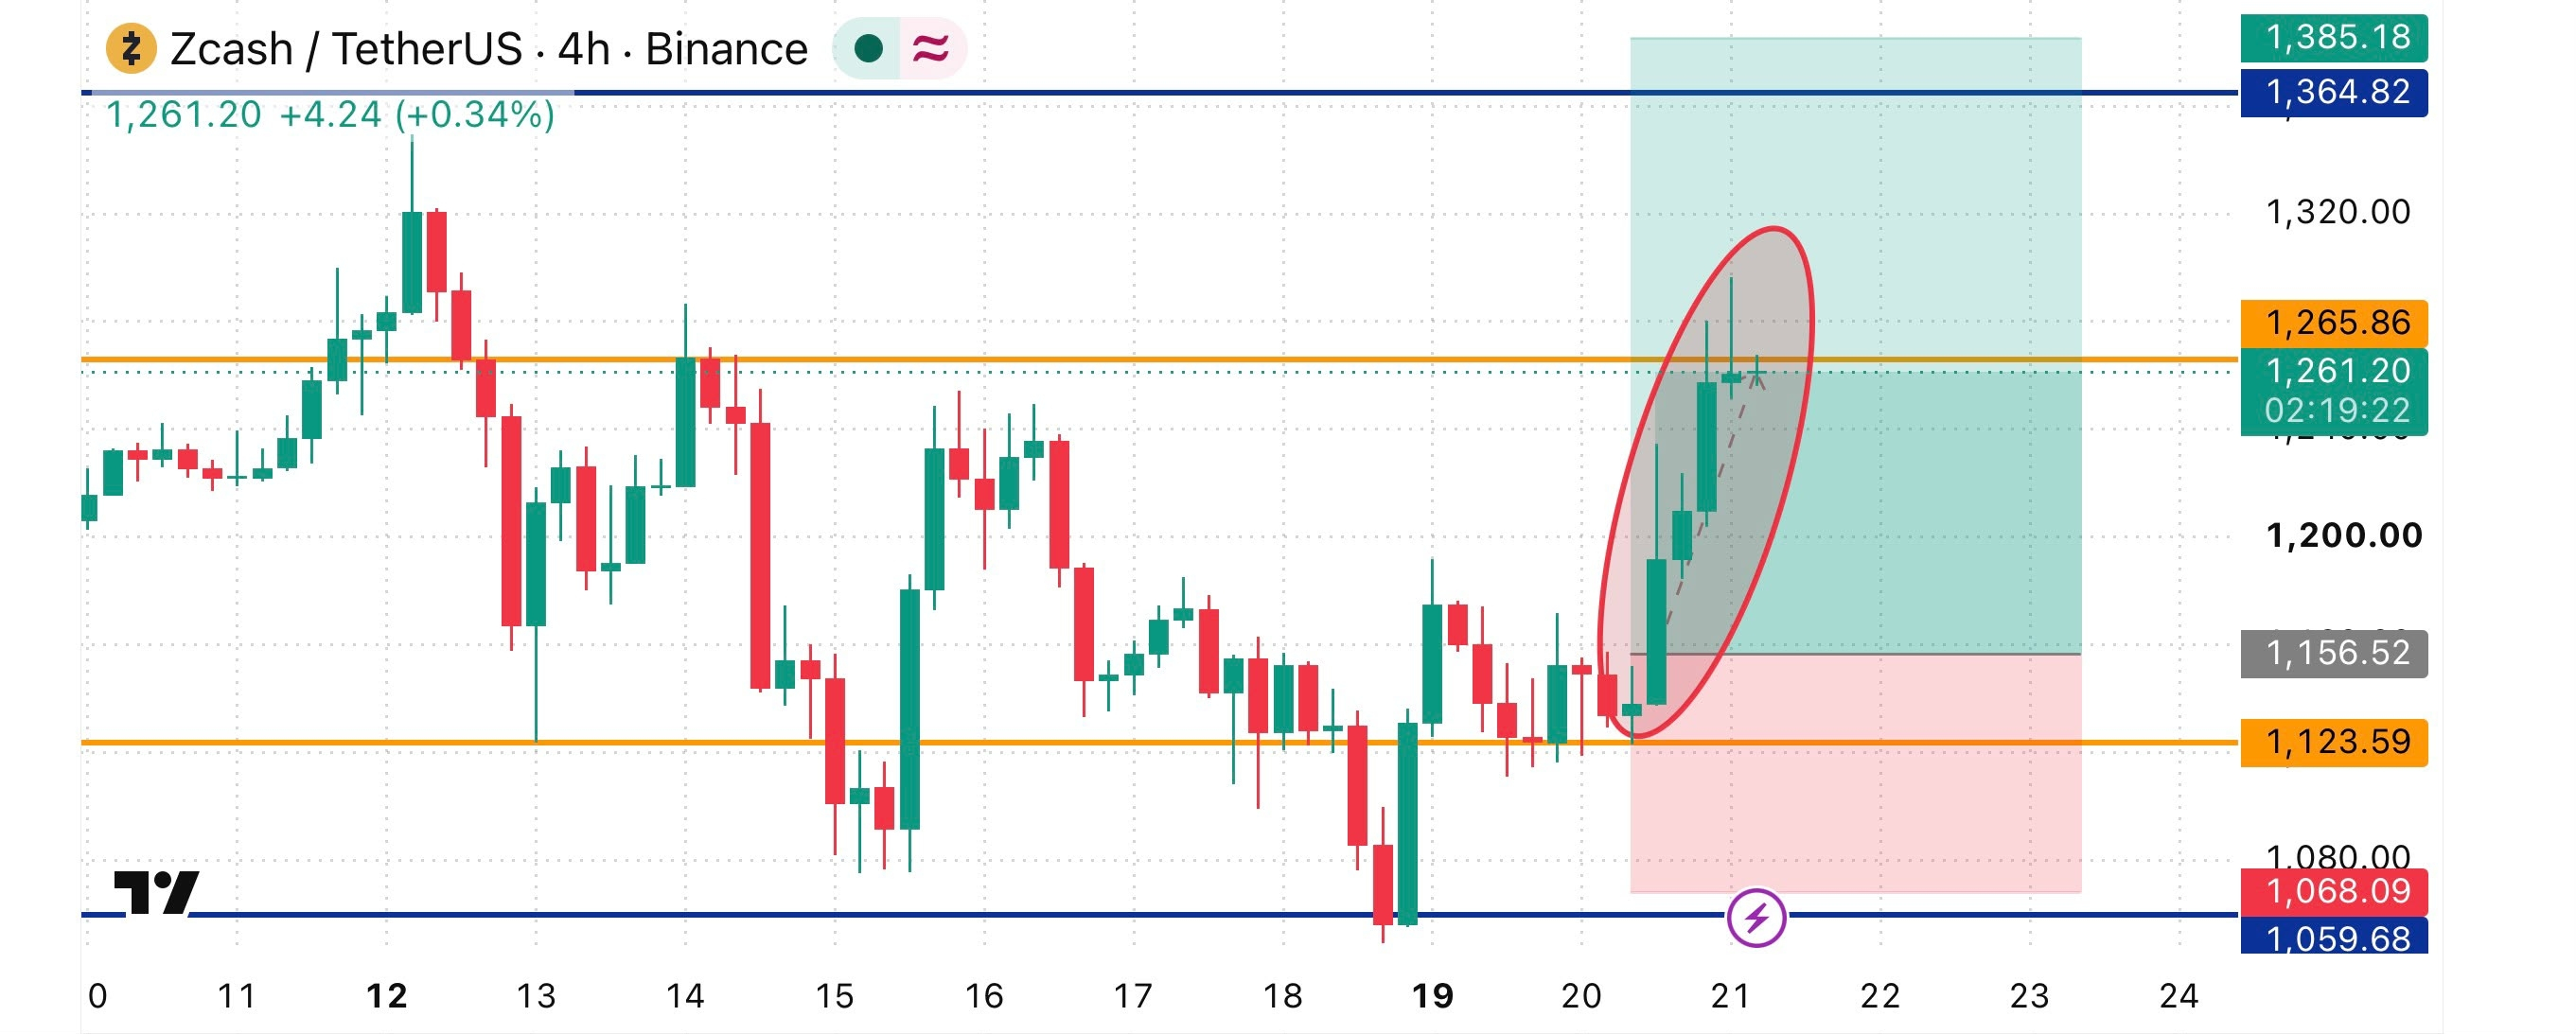
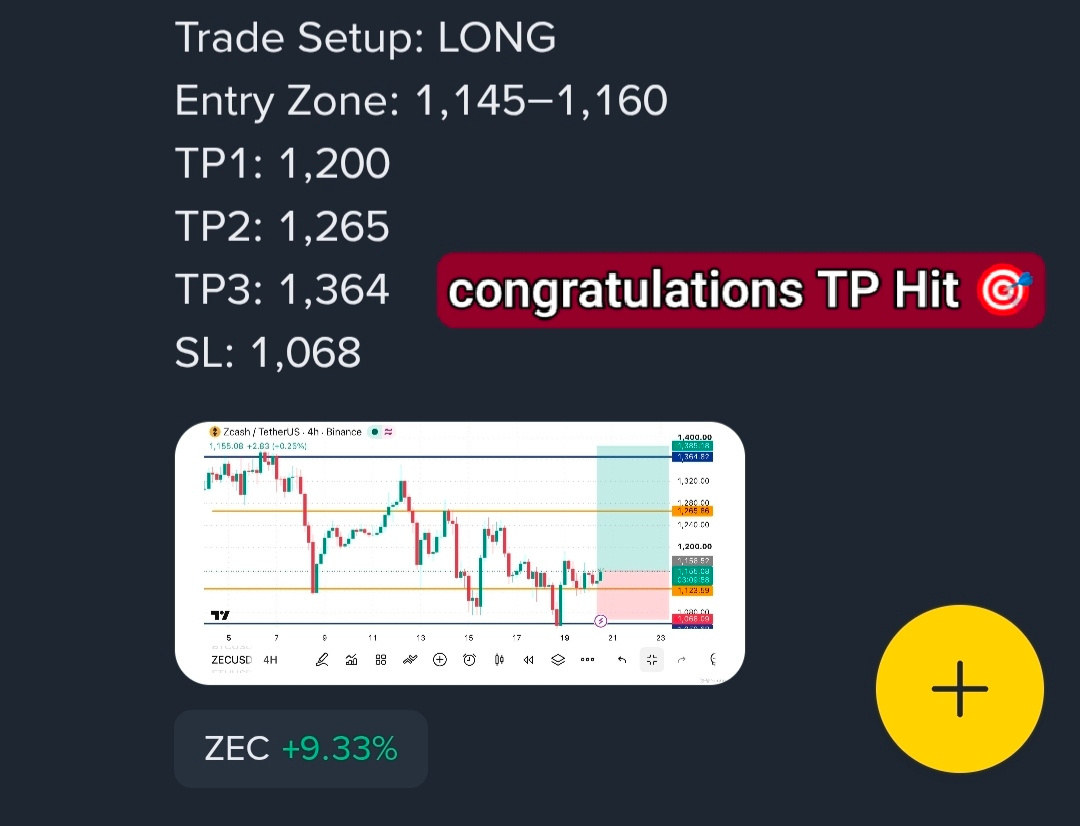
$ZEC Our Previous LONG Trade Delivered, and the Next Bullish Opportunity Is Taking Shape

Congratulations to everyone who followed our previous ZEC LONG setup! Our entry around 1,156 played out well, and the price moved toward our target, breaking above the nearby resistance at 1,265 and extending toward the 1,300 area. This is a great example of how patience and proper technical analysis can help identify trading opportunities.

Now, it is showing strong bullish momentum after breaking above the 1,265 resistance zone. If buyers maintain control and the price confirms another breakout, the next potential targets are the higher resistance levels at 1,364 and 1,385. I’m watching for a fresh LONG opportunity, but confirmation is important before entering.

Next Trade Setup: LONG

Entry Zone: 1,265–1,280
TP1: 1,300
TP2: 1,364
TP3: 1,385
SL: 1,220

ZEC has broken above its previous resistance and is attempting to continue its upward move. A sustained hold above 1,265 could support further gains toward 1,364–1,385, while a return below the breakout zone could weaken the bullish setup.
go,,,👍
go,,,👍
Sonum_Sohail
·
--
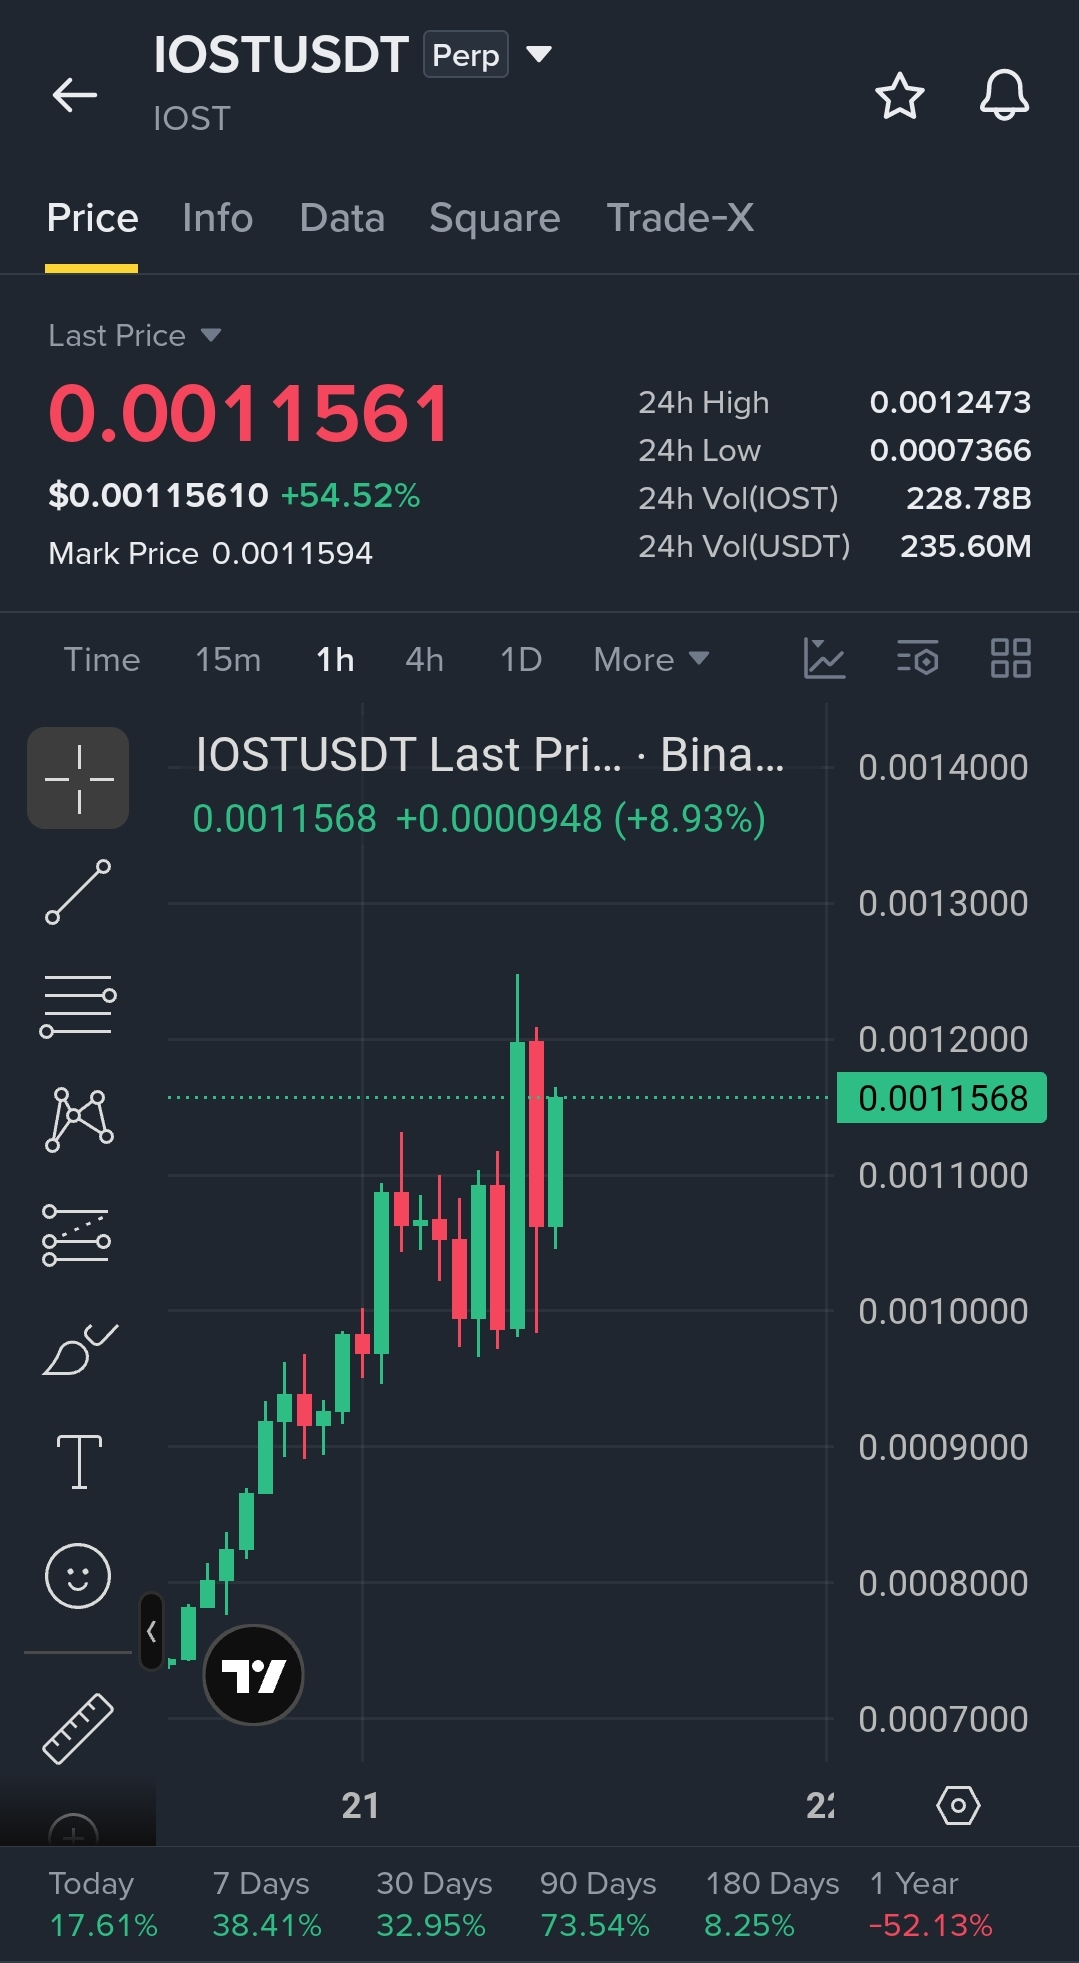
I'm watching $IOST after its impressive rally from the $0.00074 region. Price is holding near $0.00115 after testing the $0.00120 resistance, and another breakout could trigger further upside.

LONG TRADE SETUP

Entry Zone: $0.00112–$0.00116
TP1: $0.00120
TP2: $0.00125
TP3: $0.00132
SL: $0.00108

The trend remains bullish, but volatility is elevated after the sharp surge. A confirmed breakout above $0.00120 would support continuation, while a drop below the entry support could trigger a deeper pullback.
Repost
Repost
ENTRY HUNTER⁷⁸⁹
·
--
Haussier
REDPACKETS FOR ALL ..
REPOST THIS Post
JOIN MY GROUPCHAT
SHARE this with everyone !!!
#ZcashNU7ProposalWouldFreezeSproutSpending
@Siellä Tseng support needed

🍁🍂 Autumn 🥮
🍁🍂 Autumn 🥮
Syco 疯子
·
--
🍁 Autumn Changes, Crypto Opportunities! 🍂🚀

Autumn teaches us that change is a natural part of growth. Just as golden leaves fall to make room for new beginnings, the crypto market creates new opportunities for those who stay curious and keep learning. 🟡📈

On Binance, every market movement is a chance to improve your knowledge, strengthen your strategy, and build patience. Remember, smart decisions matter more than chasing every trend. Stay informed, manage your risks, and enjoy the journey! 💛

🍂 New season, new lessons, fresh crypto goals!

What’s your biggest crypto goal this autumn?

#Binance #BinanceSquare #AutumnVibes #CryptoCommunity #CryptoJourney
@Syco 疯子 $BNX $AOP

7777
7777
EASY喊單哥
·
--
选择没有绝对的对错,重要的是带着勇气向前,看这万家灯火,每一盏都在照亮自己的方向!
别让过去的选择困住现在的自己,就像这片海,无论潮起潮落,始终向前!
不必为选择而纠结,每一步都是风景,就像这夜色里的灯火,各有各的璀璨!
#BNB

btc
btc
0xDoufu-撸毛爱好者
·
--
周一福利来啦
新的一周新的福利$BTC
Connectez-vous pour découvrir plus de contenu
Rejoignez la communauté mondiale des adeptes de cryptomonnaies sur Binance Square
⚡️ Suviez les dernières informations importantes sur les cryptomonnaies.
💬 Jugé digne de confiance par la plus grande plateforme d’échange de cryptomonnaies au monde.
👍 Découvrez les connaissances que partagent les créateurs vérifiés.
Adresse e-mail/Nº de téléphone
Plan du site
Préférences de cookies
CGU de la plateforme