
📊 Technical Chart Analysis: MATIC/BTC - Bear and Bull Market Insights 🐻🐂
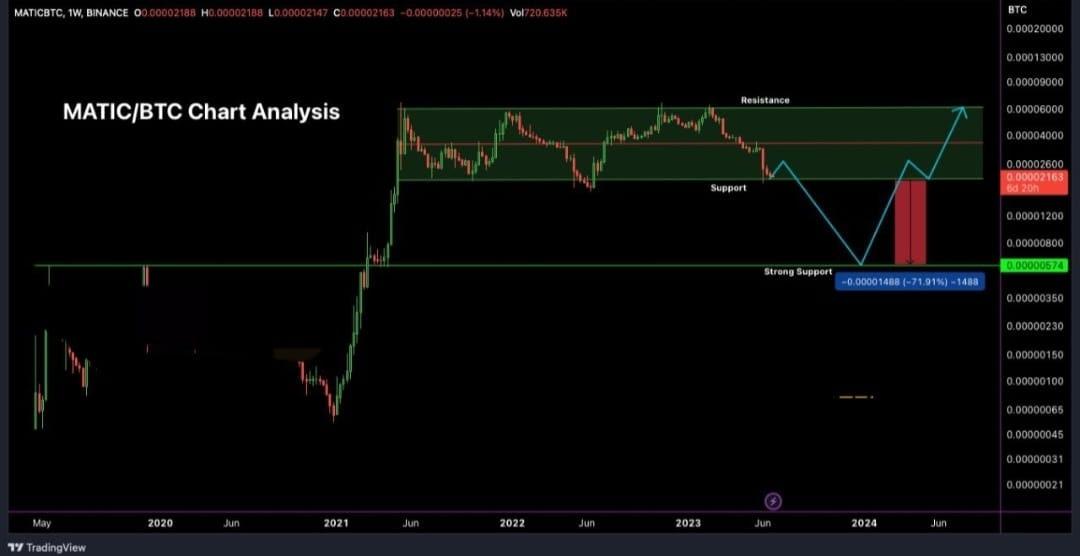
📈 Current MATIC price: 0.00002163 BTC
📉 Down 65% from all-time high
📊 Technical analysis shows MATIC/BTC forming a Bull Flag pattern on the weekly chart, indicating a potential bullish trend. However, market sentiment does not support an upward move for MATIC at this time.
📌 Bull Flag support level: 0.00002100 BTC
⚠️ If price falls below support, strong bearishness confirmed till 0.00000600 BTC
🎯 Target after breakout: 0.00000600 BTC
✂️ Represents a 60-70% decline from current level
⚠️ Never trade blindly - open trades only after confirmations!
🔻 Worst-case scenario:
If support holds at 0.00002100 BTC, MATIC might bounce to 0.000036 BTC or 0.000057 BTC before a downward leg.
💡 Key Levels:
🔹 Support: 0.000021/0.000006 BTC
🔹 Resistance: 0.000036/0.000060 BTC