$BTC I can try to help you with that. Here is my analysis of the chart:
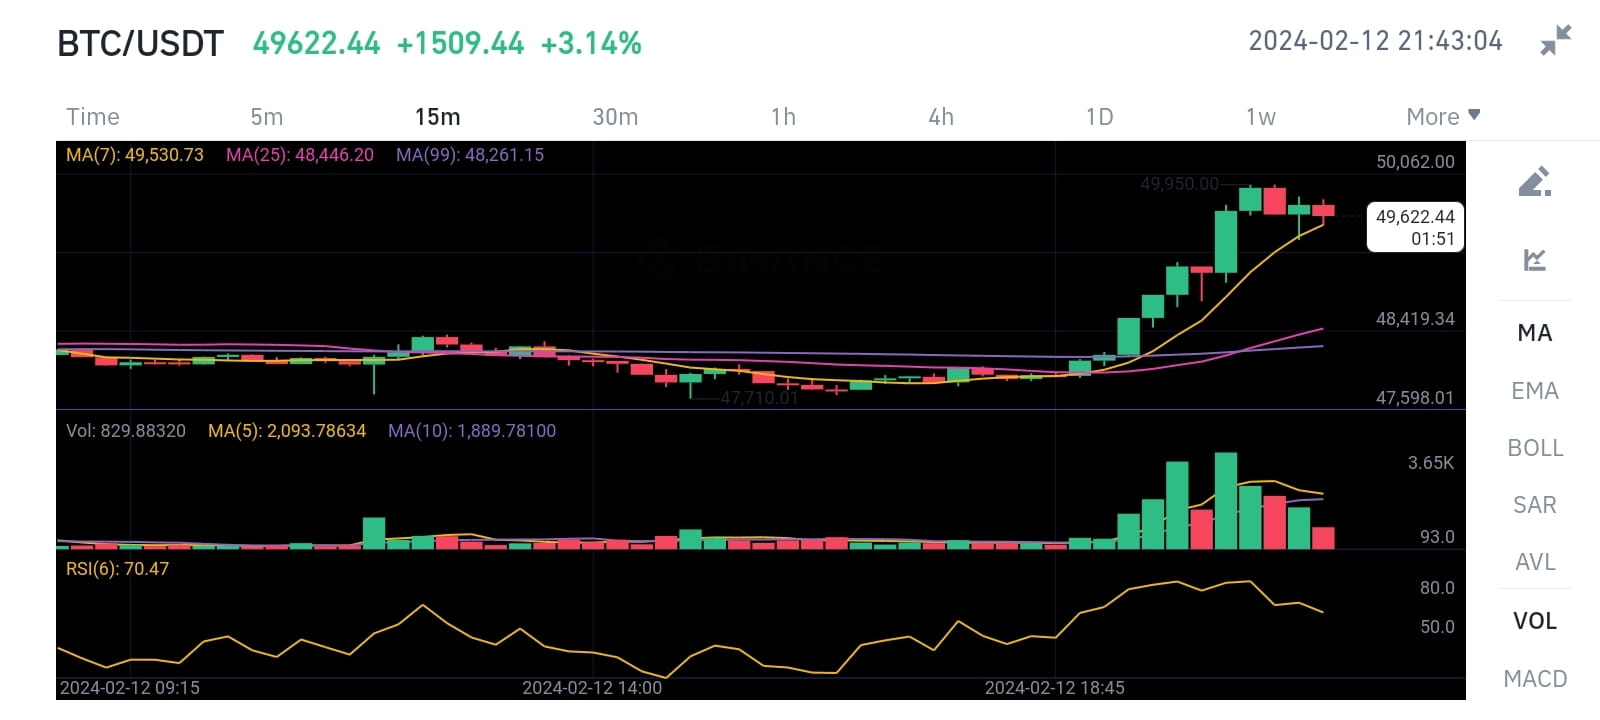
The chart shows the price movement of BTC/USDT (Bitcoin/Tether) trading pair on a 15-minute time frame.
The price is in an uptrend, as indicated by the higher highs and higher lows, and the moving averages (MA7, MA25, MA99) being in ascending order.
The support point is around 47,598.01, where the price had a consolidation before moving upwards. This level can act as a floor for the price, and if it breaks below it, it may signal a reversal of the trend.
The resistance point is at 50,062.00, where the highest price is marked. This level can act as a ceiling for the price, and if it breaks above it, it may signal a continuation of the trend.
The RSI (Relative Strength Index) is at 70.47, which is close to the overbought zone (above 70). This means that the price may be overvalued and due for a correction or a pullback.
The volume bars show that the buying volume is higher than the selling volume, which confirms the bullish sentiment of the market.
Based on this analysis, one possible trading strategy is to buy BTC/USDT at the support level of 47,598.01, and sell it at the resistance level of 50,062.00, or hold it until the trend changes. However, this is not a financial advice, and you should do your own research and risk management before making any trading decisions.
if you want more analysis like this you have to like comment
#Write2Earn
#TrendingTopic #BTC