#cryptotradingpro #BTC
📉 $BTC /USD: Bearish pressure or a pause before plunging to new depths?
Following a local peak in the $82,000–$85,000 zone, Bitcoin has seen a sharp shift in its price action. Let’s break down the current landscape across different timeframes and outline key scenarios.
📊 Technical Analysis by Timeframe:
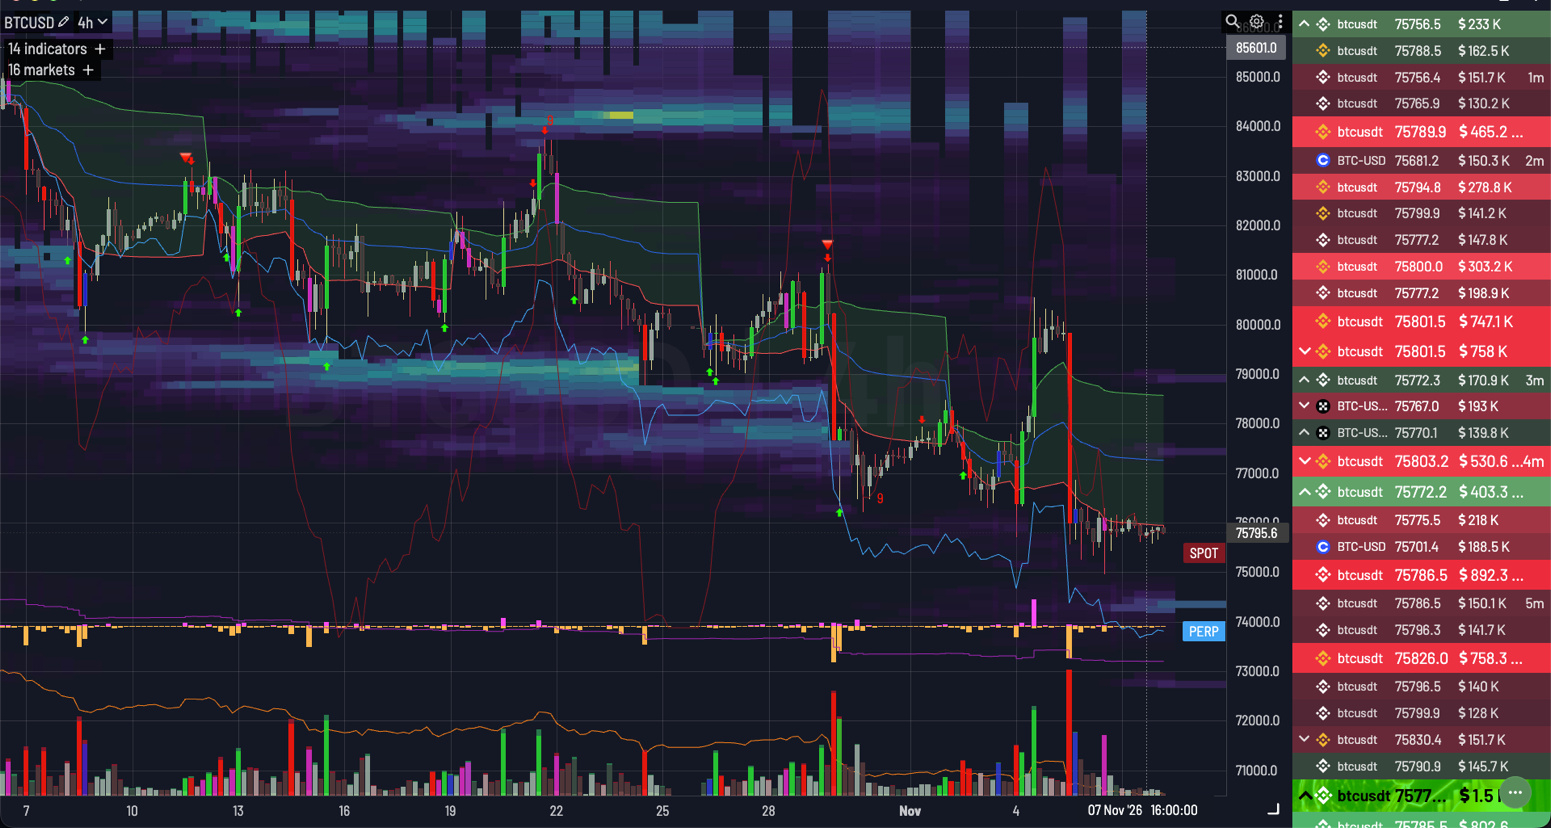
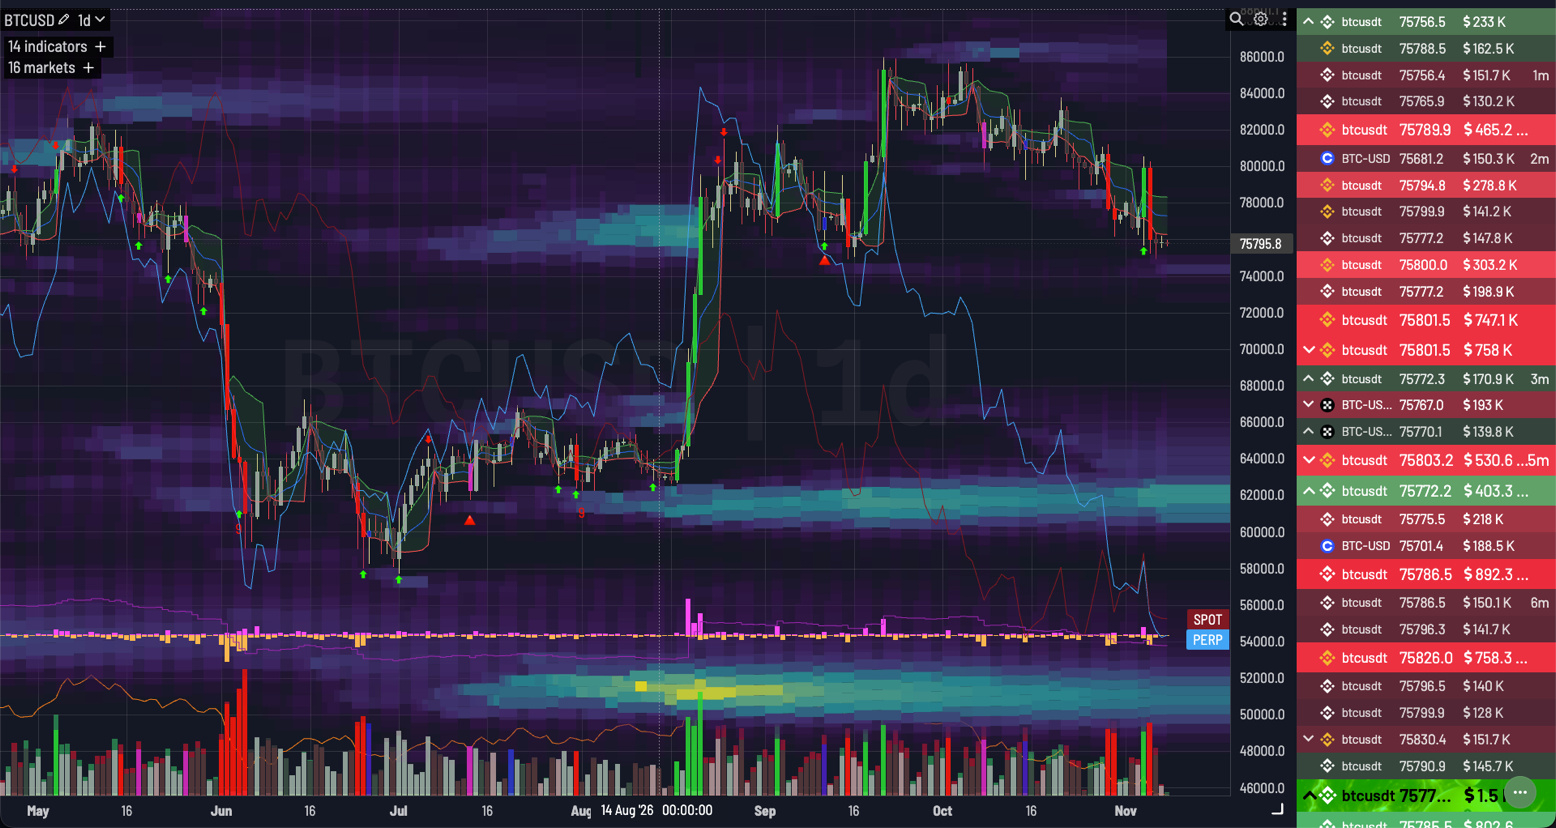
➡️ 1D & 4H (Macro Context): A strong reversal structure has formed on the daily chart. An impulsive breakdown of key moving averages on the 4H timeframe clearly indicates that the market has entered a phase of deep correction, with sellers now in control.
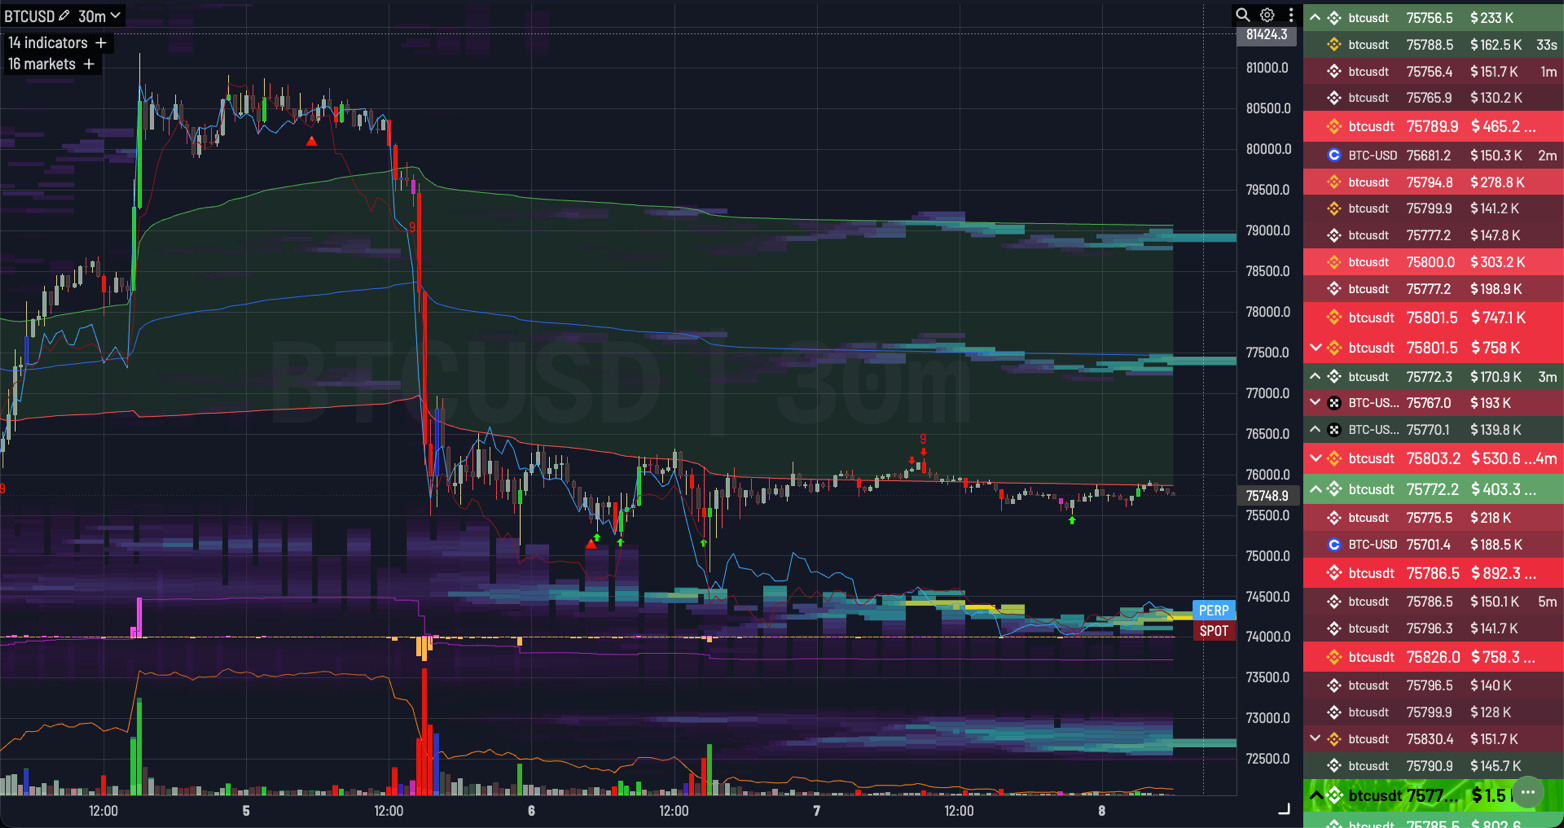
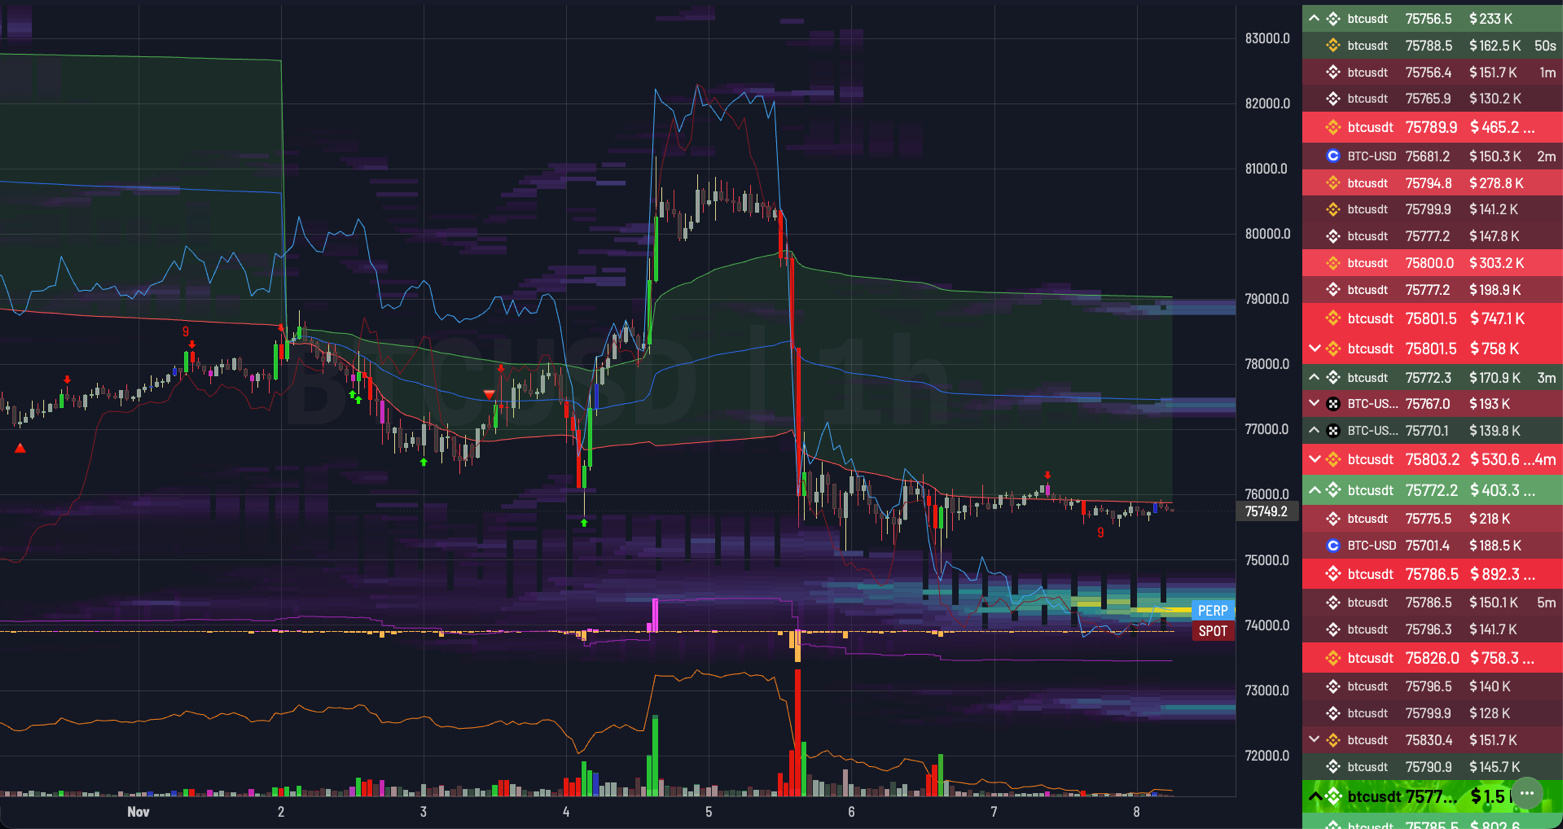
➡️ 1H & 30m (Local Structure): After a "crash dump" that swept through several liquidity pools, the price has become trapped within the $75,500–$76,000 range. This current narrow, low-volatility sideways movement resembles a classic "bear flag"—essentially a pause before the next leg down.
🎯 Key Levels to Watch:
📉 Resistance:
$77,500–$78,000 — the immediate hurdle (former support, now acting as a "flip" or mirror level).
$80,000–$82,000 — a major macro-level zone dominated by sellers.
📈 Support:
$75,000 — a critical psychological threshold. The $73,000 – $74,000 level represents the next significant zone of buyer interest in the event of a breakdown.
🚦Trading Scenarios:
🔴 Primary (bearish): Price consolidation below $75,000 paves the way for a decline toward the $73,000 – $74,000 range.
🟢 Alternative (bullish): A return of buyers and a breakout above $77,500 creates the potential for a corrective recovery toward $80,000.
📉 $BTC /USD: Bearish pressure or a pause before plunging to new depths?
Following a local peak in the $82,000–$85,000 zone, Bitcoin has seen a sharp shift in its price action. Let’s break down the current landscape across different timeframes and outline key scenarios.
📊 Technical Analysis by Timeframe:
➡️ 1D & 4H (Macro Context): A strong reversal structure has formed on the daily chart. An impulsive breakdown of key moving averages on the 4H timeframe clearly indicates that the market has entered a phase of deep correction, with sellers now in control.
➡️ 1H & 30m (Local Structure): After a "crash dump" that swept through several liquidity pools, the price has become trapped within the $75,500–$76,000 range. This current narrow, low-volatility sideways movement resembles a classic "bear flag"—essentially a pause before the next leg down.
🎯 Key Levels to Watch:
📉 Resistance:
$77,500–$78,000 — the immediate hurdle (former support, now acting as a "flip" or mirror level).
$80,000–$82,000 — a major macro-level zone dominated by sellers.
📈 Support:
$75,000 — a critical psychological threshold. The $73,000 – $74,000 level represents the next significant zone of buyer interest in the event of a breakdown.
🚦Trading Scenarios:
🔴 Primary (bearish): Price consolidation below $75,000 paves the way for a decline toward the $73,000 – $74,000 range.
🟢 Alternative (bullish): A return of buyers and a breakout above $77,500 creates the potential for a corrective recovery toward $80,000.