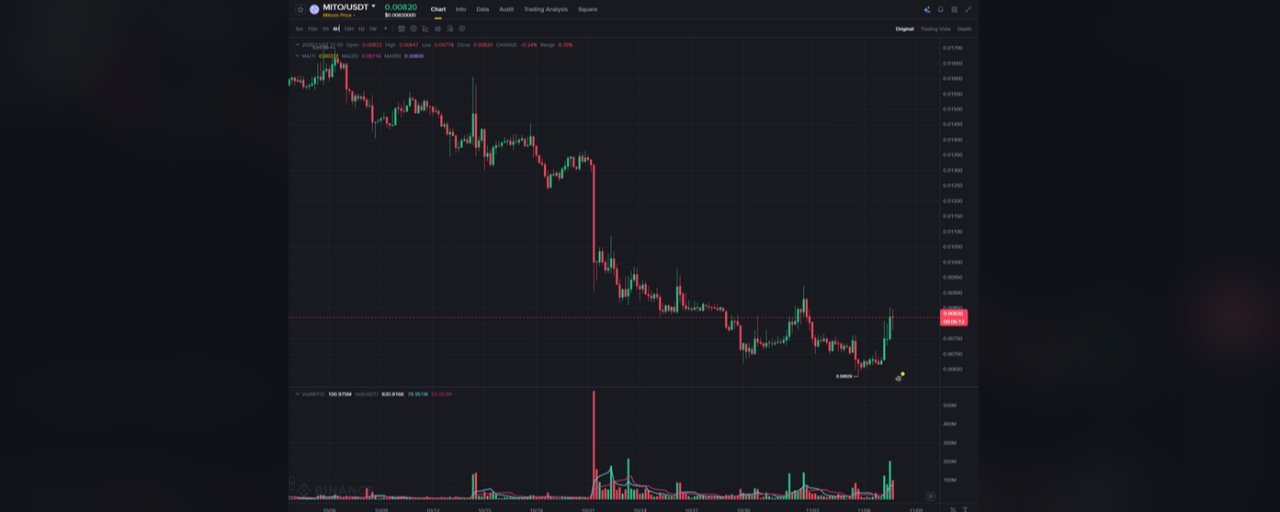

MITO/USDT is showing signs of a short-term recovery after an extended period of selling pressure. The latest daily candle has gained approximately 24.73%, accompanied by a noticeable increase in trading volume.
But is this the beginning of a genuine trend reversal, or just another temporary bounce?
1. Market Structure
MITO has experienced a significant long-term downtrend, falling from the $0.08 region toward the $0.008 area.
The broader market structure remains bearish, with lower highs and lower lows dominating the chart.
2. Moving Average Analysis
Current daily moving averages:
MA7: $0.00746
MA25: $0.00963
MA99: $0.01691
Price is currently above MA7, showing short-term strength. However, it remains below MA25 and MA99, meaning the broader trend has not yet confirmed a bullish reversal.
3. Volume Analysis
A noticeable volume spike has appeared during the recent recovery.
This suggests increased market participation, but sustained buying pressure and follow-through are needed to confirm stronger demand.
4. Important Price Levels
Support: $0.00667–$0.00800
First resistance: $0.00963
Major resistance: $0.01691
A daily close above MA25 could improve the short-term outlook. Failure to hold the recent support area could bring renewed selling pressure.
5. Bullish vs Bearish Scenario
Bullish scenario: A sustained move above $0.00963 with strong volume could open the door to further recovery.
Bearish scenario: Rejection near MA25 or a breakdown below recent support could invalidate the short-term bullish momentum.
Final Thoughts
MITO is showing encouraging short-term momentum, but one strong daily candle does not confirm a trend reversal.
The next few daily candles will be important in determining whether buyers can regain control.
Are you watching MITO for a potential recovery, or do you think the broader downtrend will continue?
Share your analysis below.
#mito #CryptoAnalysis #BinanceSquare #TechnicalAnalysis #altcoins