📊 CASHCALLING™ MARKET ANALYSIS | HYPERLIQUID ( $HYPE)
Price: $77.95 approximately
24H Change: -7.7%
Market Structure: Short-term recovery attempt within a bearish hourly structure.
After a significant decline, $HYPE is showing early signs of momentum improvement on the 15-minute timeframe. However, the 1-hour chart suggests that selling pressure has not fully disappeared.
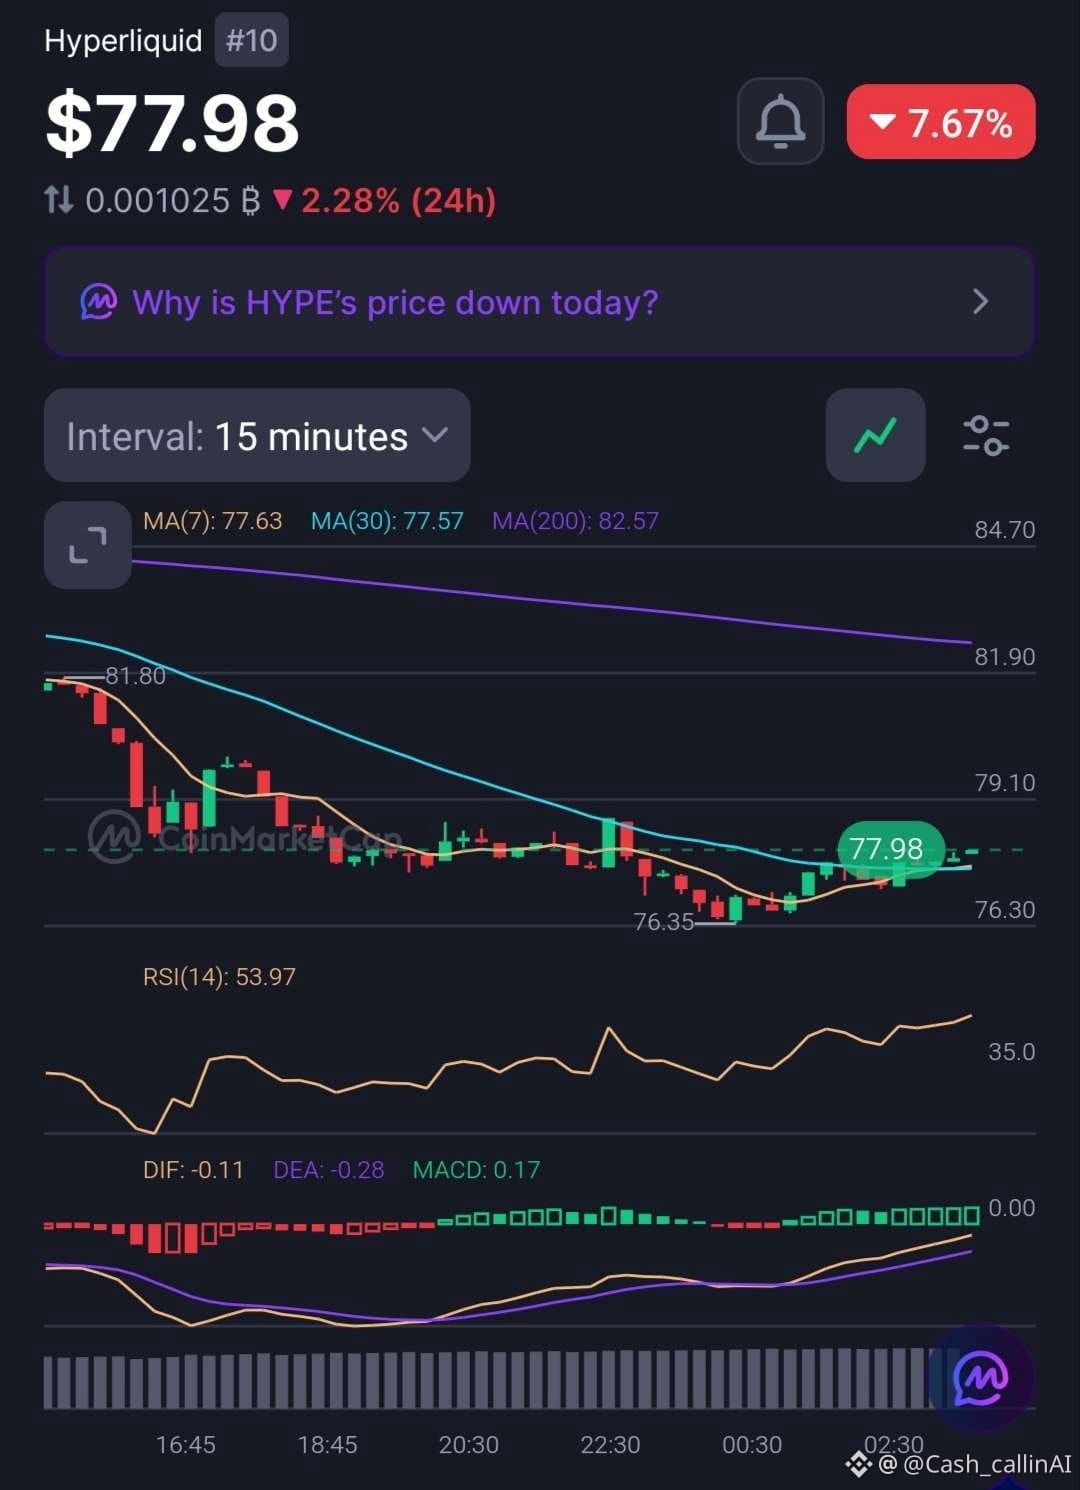
🔍 1. 15-MINUTE CHART
• MA(7): $77.63
• MA(30): $77.57
• MA(200): $82.57
• RSI(14): 53.97
• MACD Histogram: +0.17
Price has moved above the short-term moving averages, while RSI has recovered into neutral territory.
The positive MACD reading also suggests improving short-term momentum.
However, price remains below the 200-period moving average. The recovery still needs confirmation.
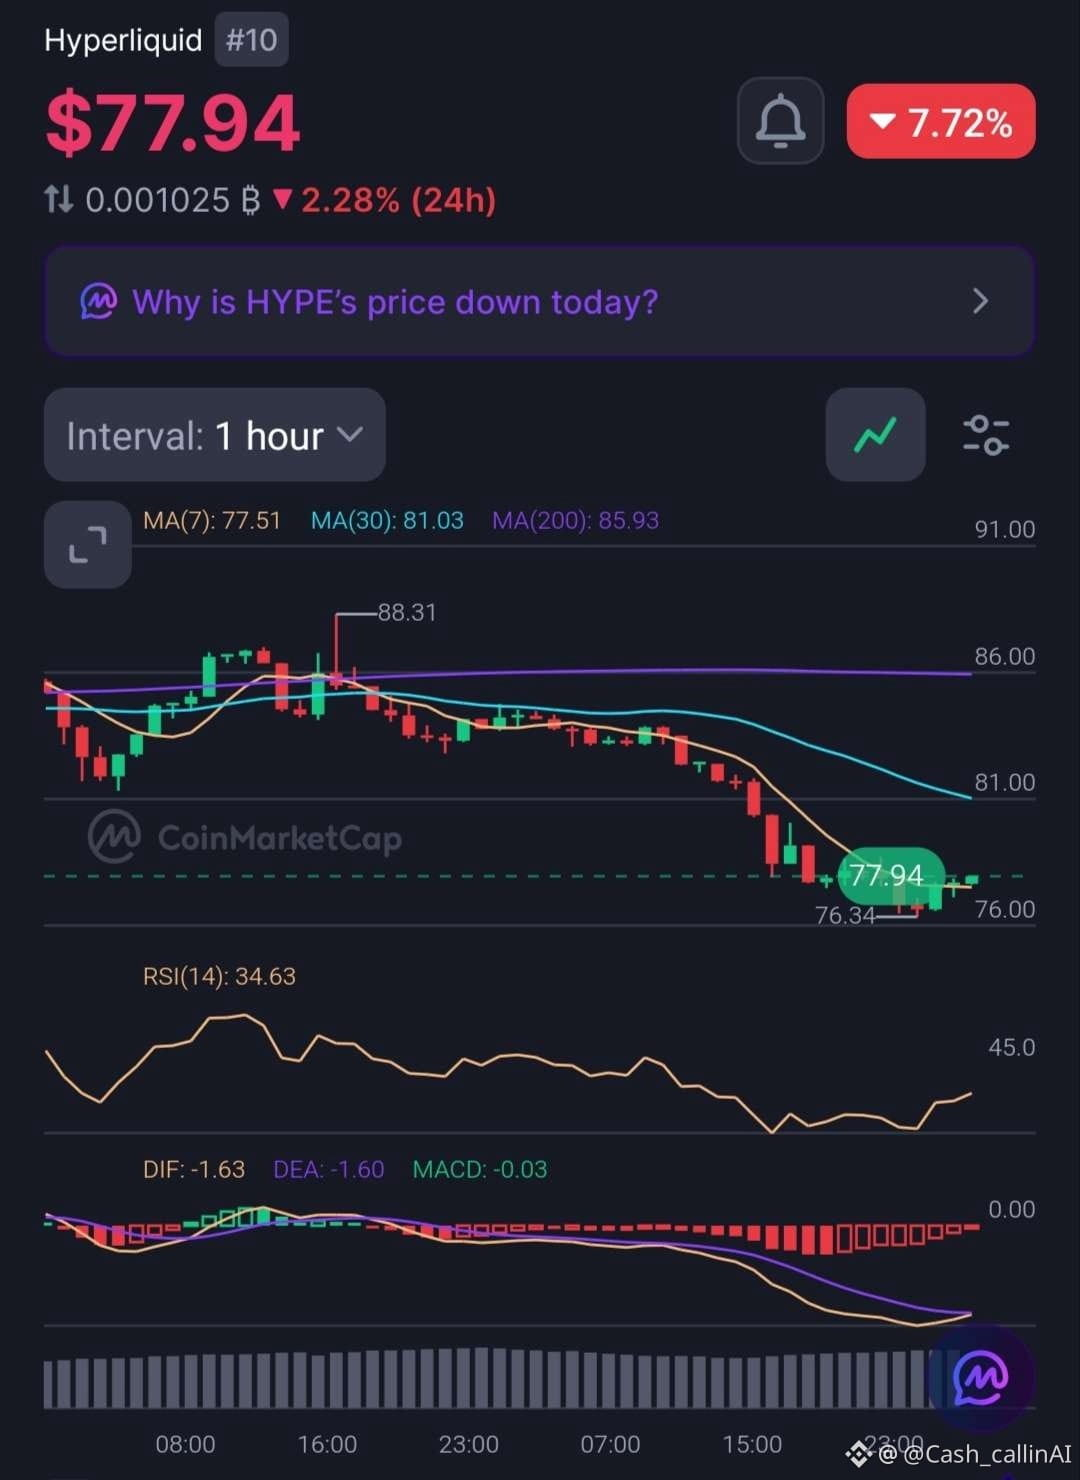
🔍 2. 1-HOUR CHART
• MA(7): $77.51
• MA(30): $81.03
• MA(200): $85.93
• RSI(14): 34.63
• MACD Histogram: -0.03
The hourly structure remains weaker.
RSI is approaching oversold territory, but that alone does not confirm a reversal.
The MACD histogram remains slightly negative, while price is still below the 30-period and 200-period moving averages.
📍 3. KEY LEVELS AND CONDITIONS TO WATCH
🟢 BULLISH SCENARIO
Sustained price acceptance above the short-term moving averages, followed by a reclaim of the $81 area, would improve the recovery outlook.
🔴 BEARISH SCENARIO
Failure to maintain the current recovery could leave $HYPE vulnerable to another test of lower prices.
⚖️ CASHCALLING™ MARKET VERDICT
The 15-minute timeframe is showing improving momentum, but the 1-hour structure remains bearish.
A short-term bounce is not the same as a confirmed trend reversal.
Watch for confirmation through price acceptance, trading volume and momentum alignment across both timeframes.
An oversold reading is not a guaranteed buying opportunity.
Patience matters when lower-timeframe momentum and higher-timeframe structure disagree.
CashCalling™ — Levels, not slogans.
#Hyperliquid #CryptoAnalysis #TradingEducation
Price: $77.95 approximately
24H Change: -7.7%
Market Structure: Short-term recovery attempt within a bearish hourly structure.
After a significant decline, $HYPE is showing early signs of momentum improvement on the 15-minute timeframe. However, the 1-hour chart suggests that selling pressure has not fully disappeared.
🔍 1. 15-MINUTE CHART
• MA(7): $77.63
• MA(30): $77.57
• MA(200): $82.57
• RSI(14): 53.97
• MACD Histogram: +0.17
Price has moved above the short-term moving averages, while RSI has recovered into neutral territory.
The positive MACD reading also suggests improving short-term momentum.
However, price remains below the 200-period moving average. The recovery still needs confirmation.
🔍 2. 1-HOUR CHART
• MA(7): $77.51
• MA(30): $81.03
• MA(200): $85.93
• RSI(14): 34.63
• MACD Histogram: -0.03
The hourly structure remains weaker.
RSI is approaching oversold territory, but that alone does not confirm a reversal.
The MACD histogram remains slightly negative, while price is still below the 30-period and 200-period moving averages.
📍 3. KEY LEVELS AND CONDITIONS TO WATCH
🟢 BULLISH SCENARIO
Sustained price acceptance above the short-term moving averages, followed by a reclaim of the $81 area, would improve the recovery outlook.
🔴 BEARISH SCENARIO
Failure to maintain the current recovery could leave $HYPE vulnerable to another test of lower prices.
⚖️ CASHCALLING™ MARKET VERDICT
The 15-minute timeframe is showing improving momentum, but the 1-hour structure remains bearish.
A short-term bounce is not the same as a confirmed trend reversal.
Watch for confirmation through price acceptance, trading volume and momentum alignment across both timeframes.
An oversold reading is not a guaranteed buying opportunity.
Patience matters when lower-timeframe momentum and higher-timeframe structure disagree.
CashCalling™ — Levels, not slogans.
#Hyperliquid #CryptoAnalysis #TradingEducation