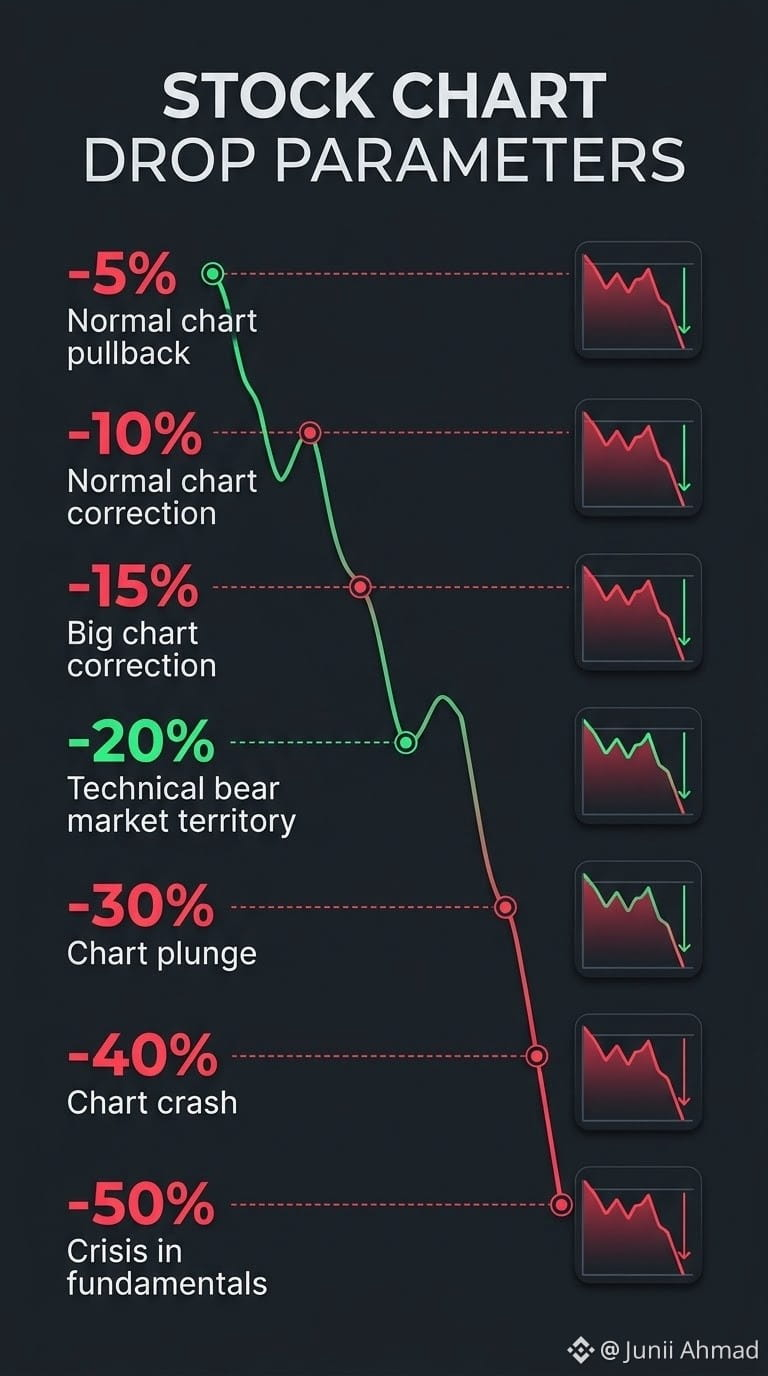
Paramètres de baisse du graphique :
-5 % = Repli normal du graphique
-10 % = Correction normale du graphique
-15 % = Forte correction du graphique
-20 % = Zone de marché baissier technique
-30 % = Chute brutale du graphique
-40 % = Krach du graphique
-50 % = Crise des fondamentaux
#USMidtermElections #BinanceRestores28FiatWithdrawals #USOctoberNFP-AreRateCutsStillPossible #BinanceWithdrawalScamWarning #AppleEarningsAhead-CanStockHitNewHigh
-5 % = Repli normal du graphique
-10 % = Correction normale du graphique
-15 % = Forte correction du graphique
-20 % = Zone de marché baissier technique
-30 % = Chute brutale du graphique
-40 % = Krach du graphique
-50 % = Crise des fondamentaux
#USMidtermElections #BinanceRestores28FiatWithdrawals #USOctoberNFP-AreRateCutsStillPossible #BinanceWithdrawalScamWarning #AppleEarningsAhead-CanStockHitNewHigh