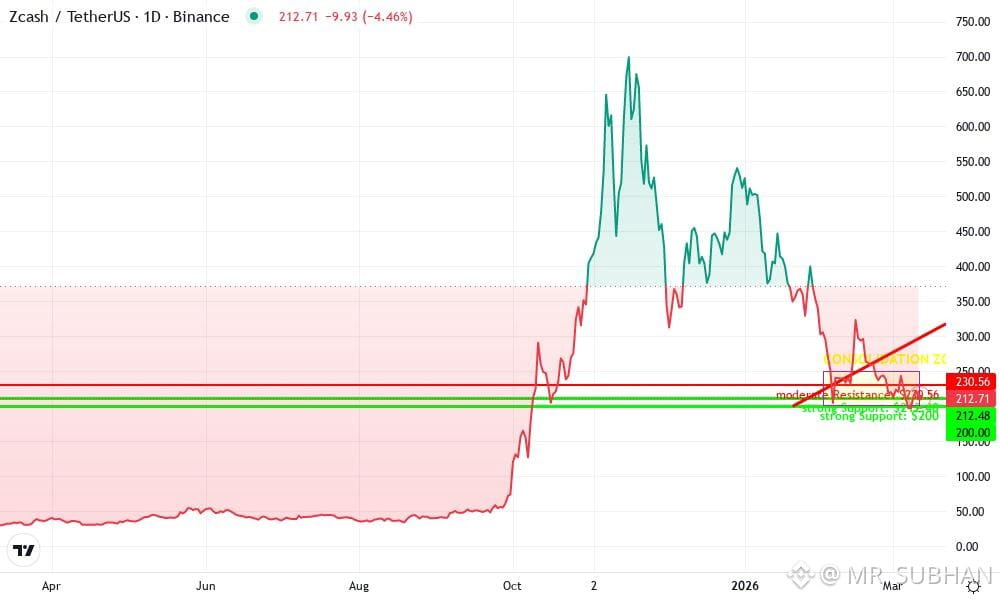
$ZEC will go to UP ????
#YiHe:ProofOfReserves:10TokensAt100%Backing #BinanceSAFUFundTransferCompleted7499BTC
Timeframe Signal Interpretation
15-minute 🔴 Bearish Bear flag pattern detected
1-hour 🟡 Neutral Consolidation, bearish double top forming
4-hour 🟡 Sideways Price below short-term averages
1-day 🟢 Bullish structure Larger uptrend remains intact
1-week 🟢 Bullish Strong longer-term trend
The 15-minute chart shows a confirmed bear flag, while the daily chart still has a broader bullish structure. This is a short-term correction within a potentially larger uptrend, rather than a confirme
Trading scenarios
Bullish scenario
Price holds above $1,230.
A 4H candle closes above $1,254.
Next resistance: $1,271–$1,278.
A stronger breakout above $1,278 could improve bullish momentum.
Bearish scenario
Price fails to reclaim $1,254.
A 4H candle closes below $1,230.
Next support: $1,192.
A breakdown below $1,192 would signal a deeper correction.
5. Indicators and momentum
Indicator Latest reading Signal
RSI (14), 1H ~39–45 Weak momentum
MACD Negative Bearish
Stochastic RSI Oversold Possible relief bounce
Moving averages Mostly sell Short-term bearish
Daily RSI ~50 Neutral
#YiHe:ProofOfReserves:10TokensAt100%Backing #BinanceSAFUFundTransferCompleted7499BTC
Timeframe Signal Interpretation
15-minute 🔴 Bearish Bear flag pattern detected
1-hour 🟡 Neutral Consolidation, bearish double top forming
4-hour 🟡 Sideways Price below short-term averages
1-day 🟢 Bullish structure Larger uptrend remains intact
1-week 🟢 Bullish Strong longer-term trend
The 15-minute chart shows a confirmed bear flag, while the daily chart still has a broader bullish structure. This is a short-term correction within a potentially larger uptrend, rather than a confirme
Trading scenarios
Bullish scenario
Price holds above $1,230.
A 4H candle closes above $1,254.
Next resistance: $1,271–$1,278.
A stronger breakout above $1,278 could improve bullish momentum.
Bearish scenario
Price fails to reclaim $1,254.
A 4H candle closes below $1,230.
Next support: $1,192.
A breakdown below $1,192 would signal a deeper correction.
5. Indicators and momentum
Indicator Latest reading Signal
RSI (14), 1H ~39–45 Weak momentum
MACD Negative Bearish
Stochastic RSI Oversold Possible relief bounce
Moving averages Mostly sell Short-term bearish
Daily RSI ~50 Neutral