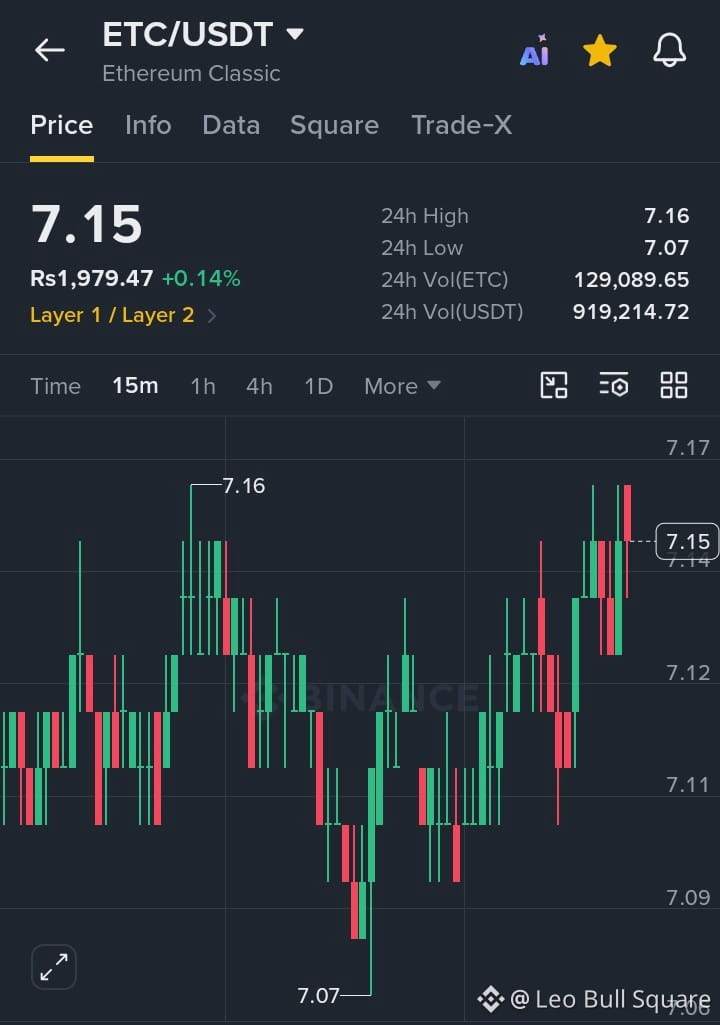
🚀 $ETC TESTING $7.16 RESISTANCE — BREAKOUT OR SHARP REVERSAL NEXT?
$ETC /USDT is showing fresh bullish momentum on the 15-minute chart, currently trading at $7.15 after bouncing strongly from the $7.07 support zone. Buyers are now testing a critical resistance at $7.16, where a confirmed breakout with strong volume could trigger bullish continuation toward TP1: $7.18 and TP2: $7.20. However, rejection from this resistance could bring a pullback toward $7.12 and $7.09. Watch for a clean candle close above $7.16 or a confirmed bearish rejection before entering. Stay patient, follow price action, and manage your risk carefully!
#ETC