



Orochi Network (ON) is catching traders' attention with a strong 14.79% gain in 24 hours.
Currently trading around $0.2197, ON is showing bullish signals across multiple timeframes.
But there's one important question:
Can ON break $0.2547, or will sellers stop the rally?
📊 Technical Breakdown
1H Chart
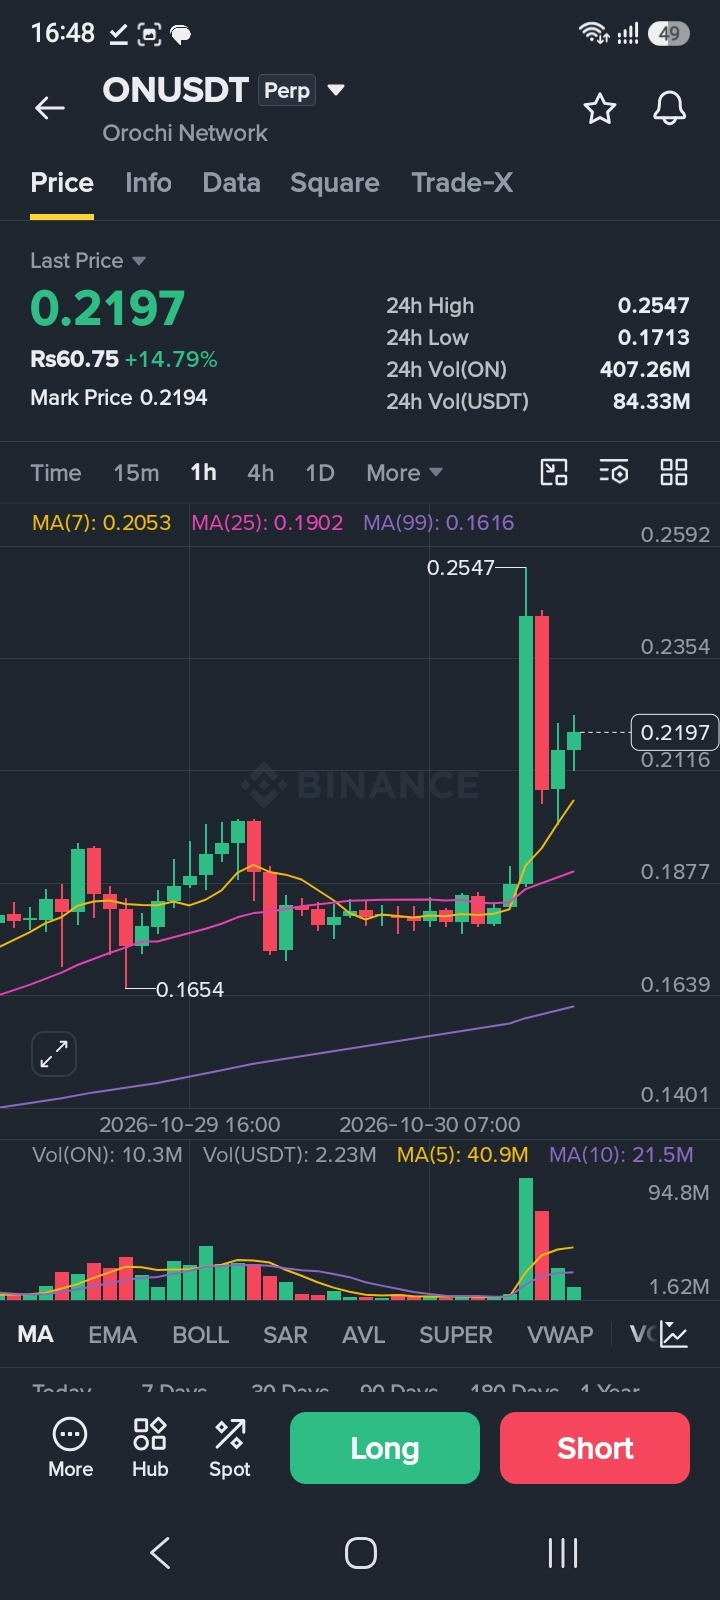
MA(7): $0.2053
MA(25): $0.1902
MA(99): $0.1616
Price remains above all three moving averages, indicating positive short-term momentum.
4H Chart
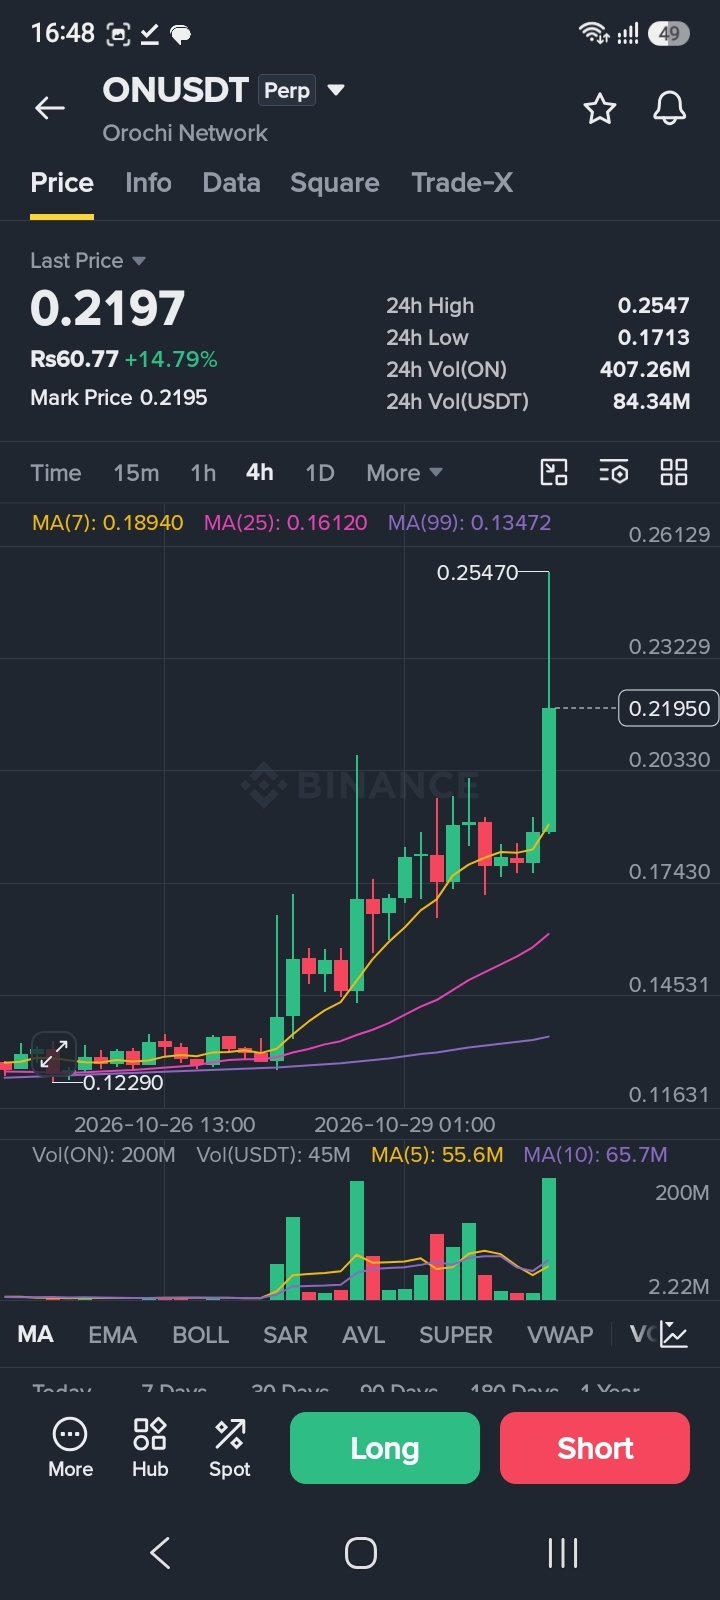
MA(7): $0.1894
MA(25): $0.1612
MA(99): $0.1347
The 4H structure remains strongly bullish.
1D Chart
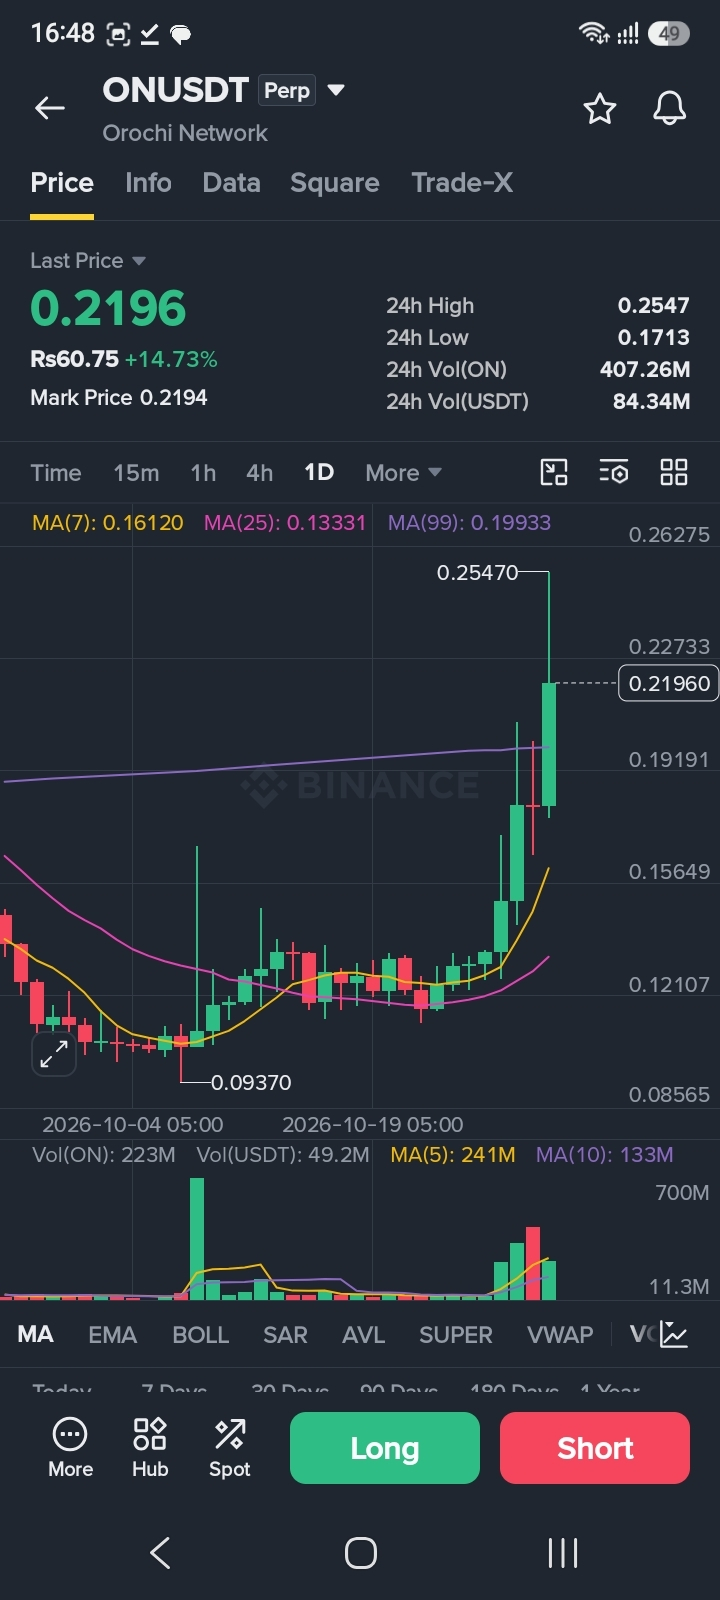
The daily chart also shows a positive structure, with price above its major moving averages.
🎯 Key Levels to Watch
Resistance:
$0.2323
$0.2547
$0.2628
Support:
$0.2116
$0.2033
$0.1877
🔥 Bullish Scenario
A strong move above $0.2323 with volume confirmation could open the door toward $0.2547.
⚠️ Bearish Scenario
Failure to hold $0.2116 could lead to a pullback toward $0.2033 or $0.1877.
My Take
ON has an interesting bullish structure, but the recent rejection near $0.2547 deserves attention.
The next breakout needs volume confirmation. Chasing a fast-moving candle can be risky.
Can Orochi Network reach $0.26 next? What's your prediction?

Share your thoughts below!
Technical analysis based on the supplied Binance chart screenshots. Educational purposes only. Not financial advice.
#ON #OrochiNetwork #CryptoAnalysis #BinanceSquare #Altcoins #CryptoTrading #TechnicalAnalysis