[OCTOBER 29 Bitcoin chart analysis]
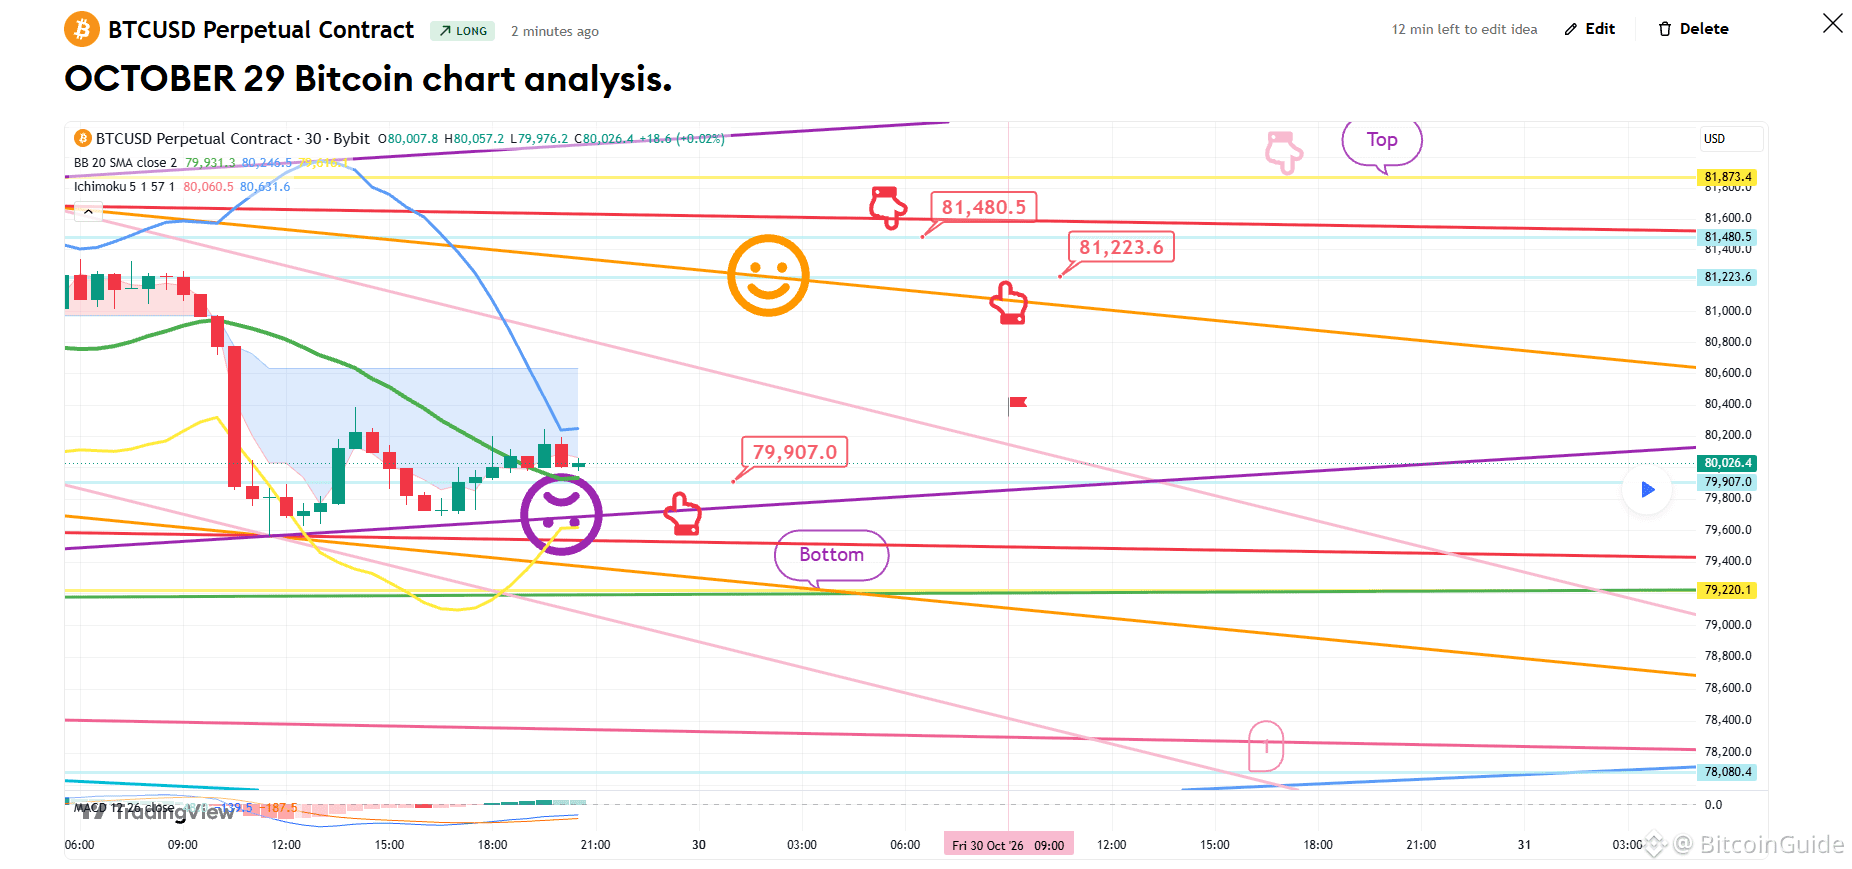
BTCUSD 30Min Chart
*My analysis is optimized for TradingView.
If you press the replay button, you can check real-time movements.
-Long position strategy-
The Nasdaq is currently showing very erratic, messy price action.
If we can successfully navigate through this risky period today,
we may see a rebound later tonight or from tomorrow onwards.
*If the price follows the path indicated by the red arrow:
Long position strategy
1) Entry zone for a long position: $79,907 | Stop-loss: If the price breaks below the purple support line.
2) First target for the long position: $81,480.5 | Second target: The "Top" level.
- If the strategy succeeds, the $81.2K level can be used as an entry point for a new long position.
- If the price breaks below the purple support line,
it could decline toward the "Bottom" zone, potentially reaching as far as the "1" zone.
Please treat this analysis as a reference only.
Ensure you trade according to your established principles and always use a stop-loss to keep your trading safe.
I post the analysis results as a Comment every day.
Thank you.
(You can find the link on my profile.)
- Click Follow to receive faster information every day.
- Check the results using the replay button on TradingView.
$TRX $USDC $USDT $BTC #Altcoin Season# #Bitcoin #Crypto# #BTC Price Analysis#