

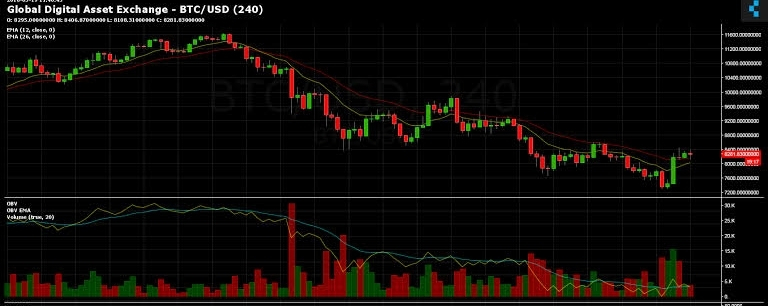

📊 $BTC /USD Technical Analysis — October 27, 2026

Current market bias: 🐻 Bearish (Short-term)
Bitcoin is facing selling pressure and is trading around $79,400–$79,600 according to the latest available market data. The price has fallen below the important $80,000 psychological level, and technical indicators suggest that further downside is possible.
1. Current Market Overview
Indicator Current Analysis
Trading Pair BTC/USD
Current Price Around $79,500
Short-Term Trend 🔴 Bearish
RSI (14) Around 40
MACD Bearish
Immediate Support $79,300
Stronger Support $78,600
Immediate Resistance $80,000–$80,700
Next Resistance $81,400
Market Sentiment Sellers have the advantage
Prices are approximate and may change rapidly.
2. Important Support and Resistance Levels
🟢 Support Levels
These are the levels where buyers might attempt to enter the market.
Support 1: $79,300
Support 2: $78,600
Support 3: $77,100–$77,800
If BTC breaks below $79,300 with strong selling volume, the price could move toward $78,600.
If $78,600 also fails to hold, the next downside area could be $77,800 or lower.
🔴 Resistance Levels
These are the levels where selling pressure could emerge.
Resistance 1: $80,000
Resistance 2: $80,700
Resistance 3: $81,400
Major Resistance: $81,800–$82,000
BTC needs to recover above $80,700 and sustain that level to improve its short-term bullish outlook.
A break above $81,400 could open the door to a stronger recovery.
3. Technical Indicator Analysis
RSI (14): Around 40
Momentum is weak.
Sellers currently have the advantage.
RSI is approaching oversold territory but does not, by itself, confirm a reversal.
MACD: Bearish
Momentum remains negative.
Downside pressure could continue unless momentum starts improving.
Moving Averages: Bearish
BTC is trading below its short-term moving averages.
The $80,700–$81,800 area could act as resistance during a recovery.
---
4. BTC/USD Trading Scenarios
🔴 Scenario A: SELL Setup
Preferred direction: Short, subject to confirmation.
Parameter Potential Level
Entry Zone $79,250–$79,400
Stop Loss $79,950
Take Profit 1 $78,900
Take Profit 2 $78,600
Take Profit 3 $77,800
Confirmation required:
BTC breaks below $79,300.
A 15-minute candle closes below support.
A retest of $79,300 fails.
⚠️ Avoid entering a short trade immediately after a sharp drop without confirmation. Price could rebound from support.
🟢 Scenario B: BUY Setup
A buy trade becomes more attractive if BTC reclaims important resistance levels.
Parameter Potential Level
Entry Zone $80,050–$80,200
Stop Loss $79,600
Take Profit 1 $80,700
Take Profit 2 $81,000
Take Profit 3 $81,400
Confirmation required:
BTC breaks above $80,000.
A 15-minute candle closes above resistance.
Price successfully retests the breakout area.
This bullish setup becomes invalid if BTC fails to hold the breakout and falls back below support.
These are illustrative trading scenarios, not confirmed live entry signals.
---
5. My Final BTC/USD Prediction
Based on the available technical data:
Market Condition Possible Direction
BTC stays below $80,000 Bearish
BTC breaks below $79,300 Potential move toward $78,600
BTC breaks below $78,600 Further downside risk
BTC reclaims $80,700 Recovery becomes more likely
BTC breaks above $81,400 Bullish momentum may strengthen
🎯 My Trading Bias
Short-term: Bearish.
The more cautious approach is to wait for confirmation around $79,300 support or $80,000 resistance rather than entering a trade based on price alone.
Risk management: Risk no more than 1% of your trading capital on a single trade, and be especially careful with leverage during volatile market conditions.
---
📈 Would you like a more precise trading setup?
I can analyze BTC/USD using one of these timeframes:
1. ⚡ 5-minute chart — scalping 2. 📊 15-minute chart — short-term trading 3. 📈 1-hour chart — intraday trading 4. 🌎 4-hour chart — swing trading