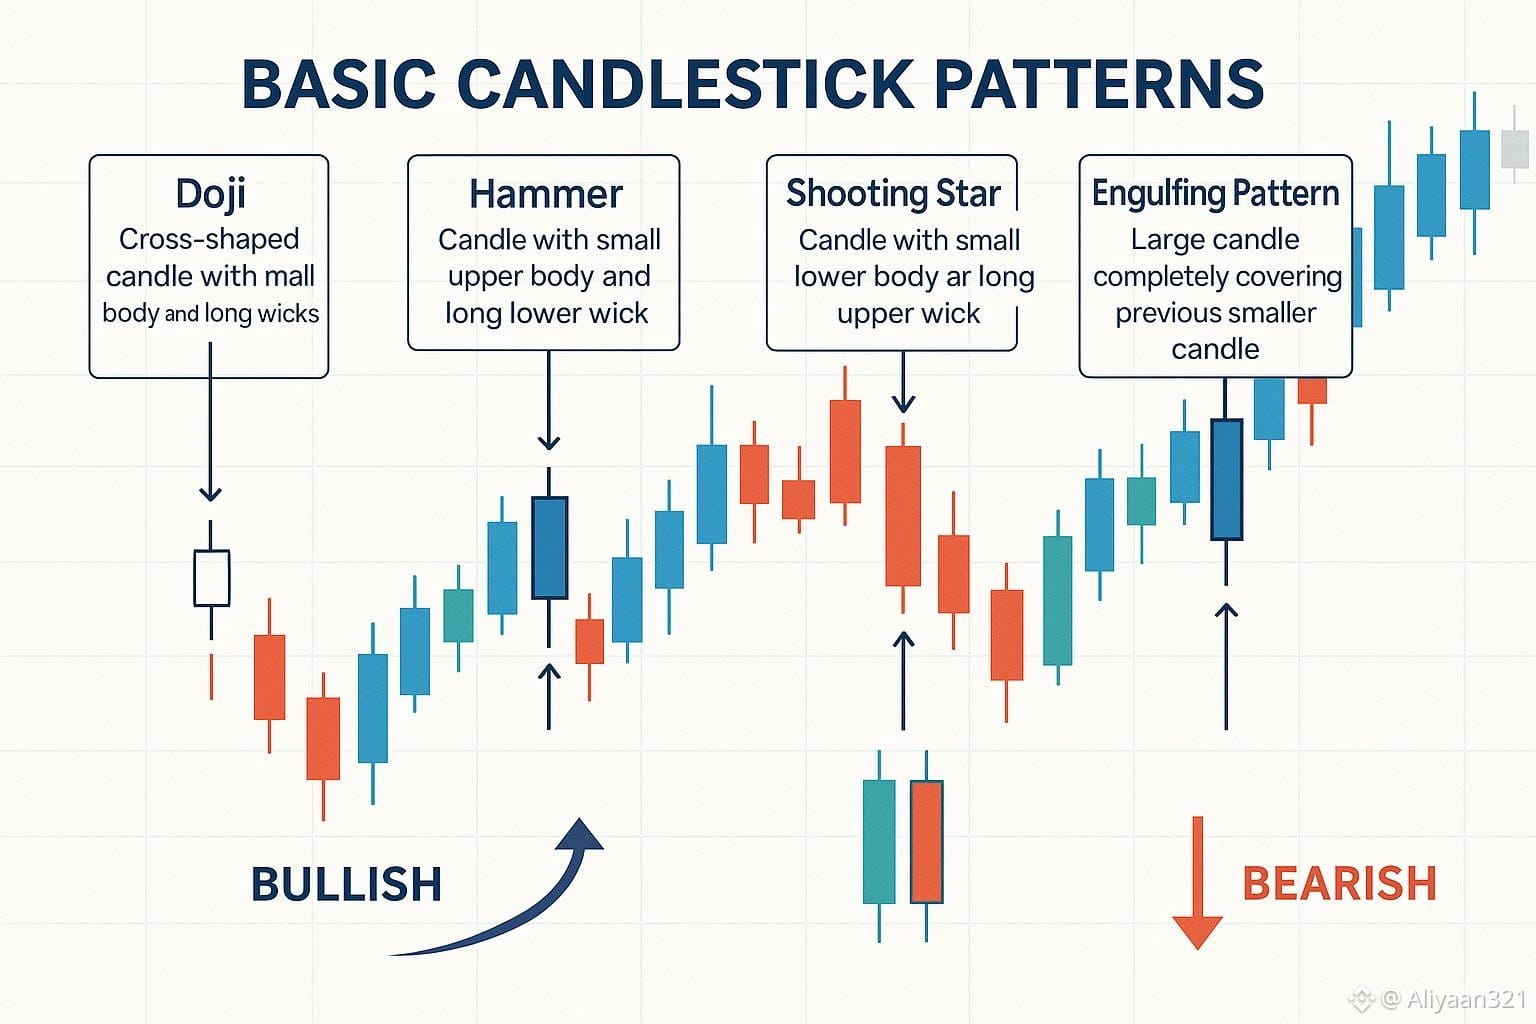
📊 5 CANDLESTICK PATTERNS EVERY CRYPTO TRADER SHOULD KNOW
Many beginners look at Bitcoin charts but don't understand what the candles are telling them.
Let's make it simple! 👇
🟢 1. Bullish Engulfing
A larger green candle covers the body of the previous red candle. After a decline, it may suggest that buying pressure is increasing.
🔴 2. Bearish Engulfing
A larger red candle covers the body of the previous green candle. After a rally, it may indicate that selling pressure is increasing.
🔨 3. Hammer
This candle has a small body and a long lower wick. It can suggest that buyers pushed the price back up after sellers drove it lower.
🌠 4. Shooting Star
It has a small body and a long upper wick. After an upward move, it may indicate that higher prices faced selling pressure.
📈 5. Doji
The opening and closing prices are very close. It can reflect indecision between buyers and sellers.
💡 THE MOST IMPORTANT RULE
No candlestick pattern guarantees a price increase or decrease.
Before making a trade:
✅ Check the overall trend.
✅ Identify support and resistance.
✅ Wait for confirmation when appropriate.
✅ Always manage your risk.
🎯 QUIZ TIME!
If Bitcoin forms a Hammer near a strong support zone, what would you do?
A) Buy immediately
B) Wait for confirmation
C) Ignore the overall trend
👇 Comment A, B, or C and explain your choice!
#bitcoin #cryptotrading #CandlestickPatterns #TechnicalAnalysis #BİNANCESQUARE