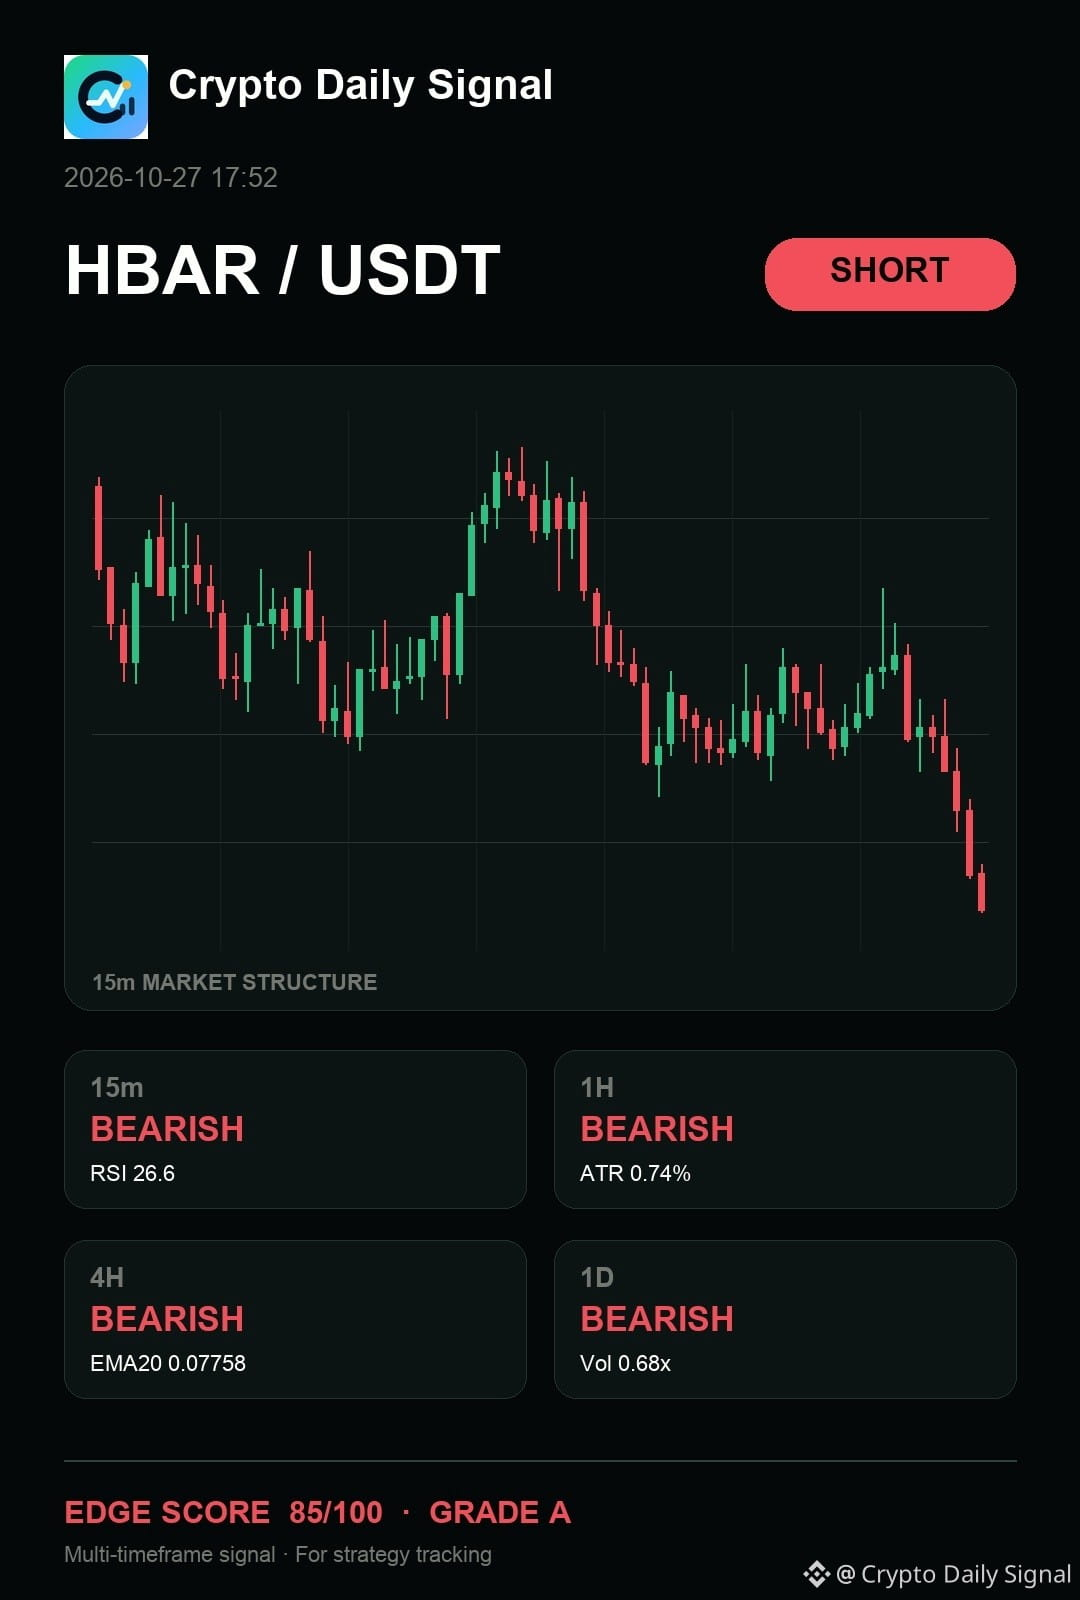
$HBAR — look, my read is simple: it has my attention on the sell side after a push failed to break out. The price is finding support at the lower edge of the range, and the recent candle action is leaning bearish across the board. If it can lock below that range floor on a down candle, the bias holds; a strong move higher would challenge this view.
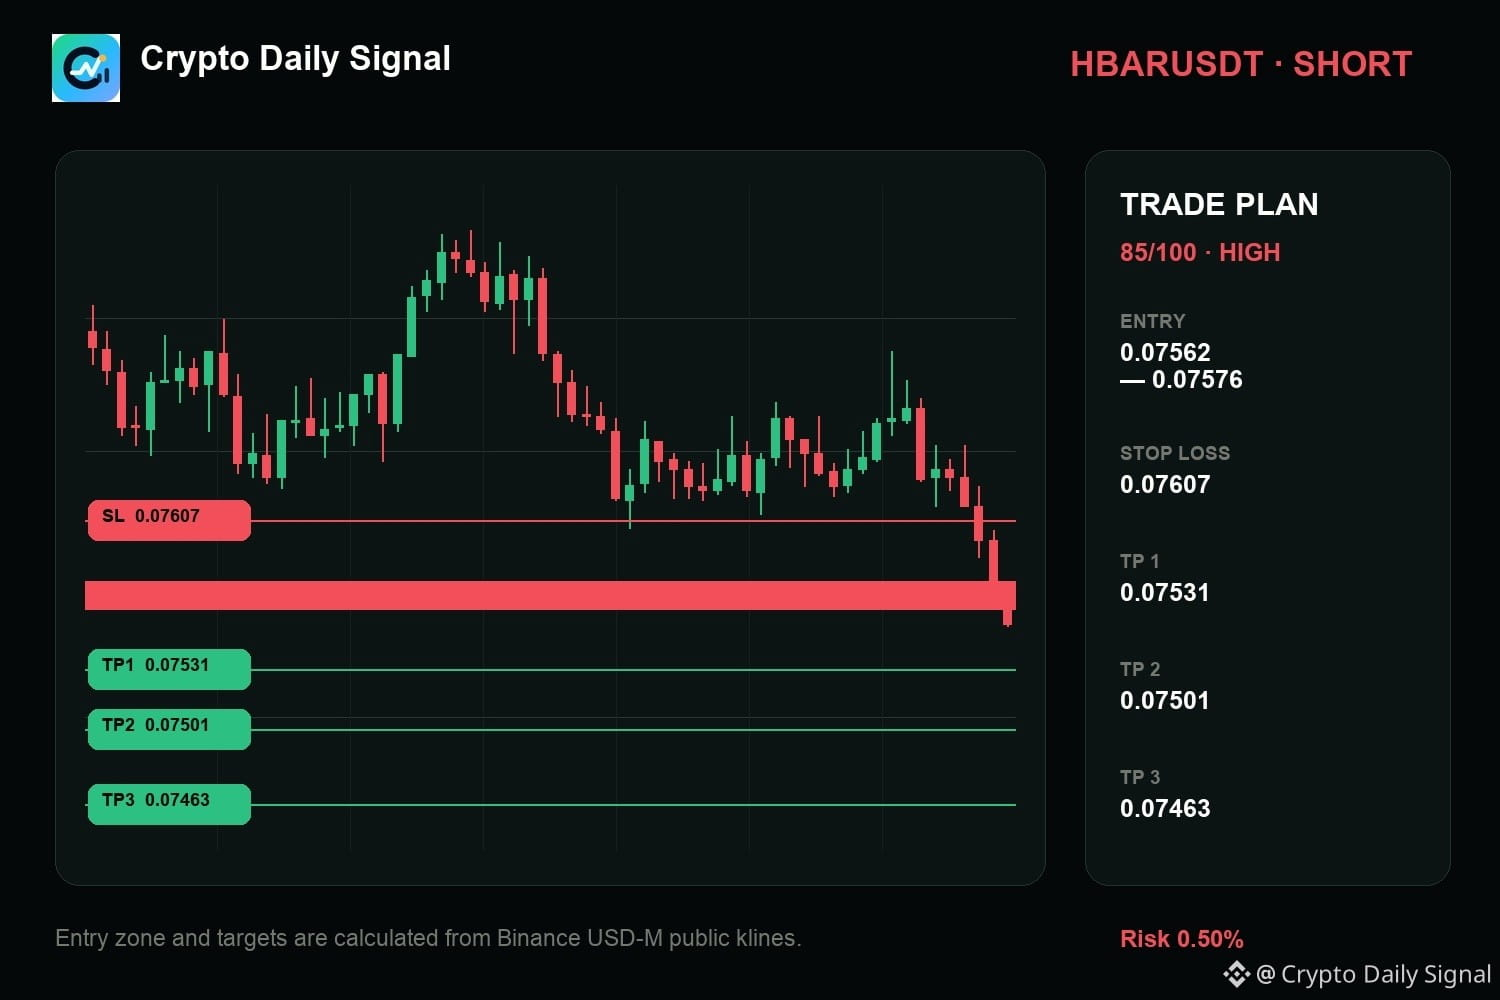
HBARUSDT SHORT map
Entry → 0.07562 - 0.07576
SL → 0.07607
TP → 0.07531 · 0.07501 · 0.07463
#TradingSignal
HBARUSDT SHORT map
Entry → 0.07562 - 0.07576
SL → 0.07607
TP → 0.07531 · 0.07501 · 0.07463
#TradingSignal