
$BTC 🚨 BITCOIN PRICE ANALYSIS: BTC AT $79.7K — BOUNCE OR BREAKDOWN?
Bitcoin is approaching a critical support zone! 📉
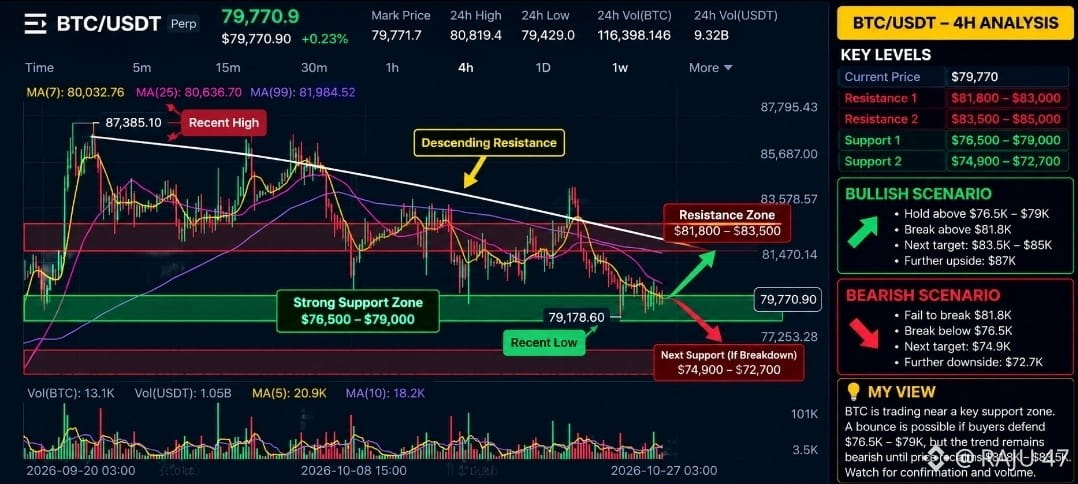
According to the provided BTC/USDT 4H chart, BTC is trading around $79,770, following a recent decline from the $87,385 region. Buyers are attempting to defend support, but the overall short-term trend remains bearish.
📊 1️⃣ KEY SUPPORT ZONES
🟢 $76,500–$79,000: The major support zone to watch. If buyers defend this area, BTC could attempt a relief bounce.
🟢 $74,900: An important lower support level if the current zone breaks.
⚠️ $72,700: A possible downside area if selling pressure accelerates.
🔴 2️⃣ RESISTANCE LEVELS
• $81,800–$83,500: The first major resistance zone.
• $83,500–$85,000: The next area to watch if bullish momentum returns.
• $87,000: A higher potential target if the recovery strengthens.
🐂 3️⃣ BULLISH SCENARIO
If BTC holds above $76,500–$79,000 and reclaims $81,800 with strong volume, a recovery toward $83,500–$85,000 could become possible.
🐻 4️⃣ BEARISH SCENARIO
If BTC fails to recover and breaks decisively below $76,500, the next levels to monitor are $74,900 and potentially $72,700.
📉 5️⃣ TECHNICAL OUTLOOK
The chart shows BTC trading below its MA(7), MA(25), and MA(99), which suggests that sellers retain the short-term advantage.
A bounce from support is possible, but a confirmed trend reversal would require stronger price action and a reclaim of resistance.
💡 MY STRATEGY
I’m watching the $76.5K–$79K support zone closely. Rather than predicting the next move, I would wait for confirmation:
✅ Support holds + bullish momentum = recovery possibility.
❌ Support breaks + strong selling = further downside risk.
Remember: These are technical scenarios, not guaranteed predictions. Always manage risk, especially when trading futures with leverage.
🔥 YOUR OPINION MATTERS!
Will BTC bounce toward $83.5K, or drop toward $74.9K next?
🐂 BULLISH or 🐻 BEARISH?
👇 Share your analysis in the comments!
#Bitcoin #BTCUSDT