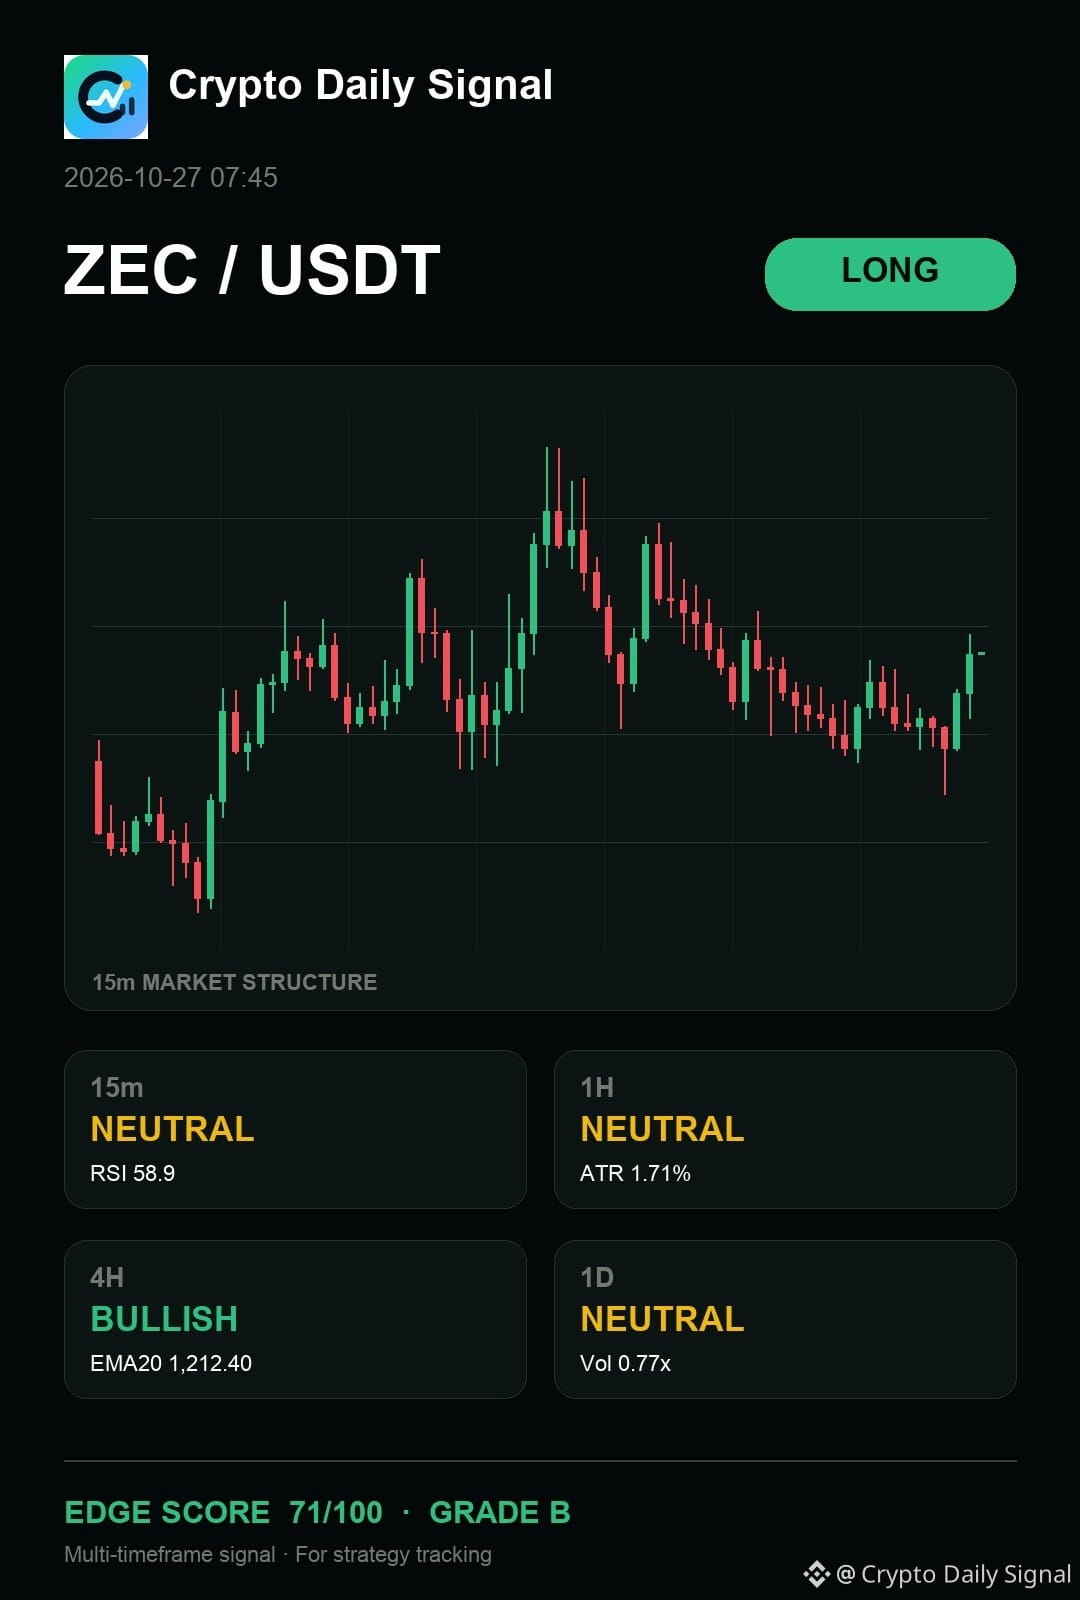
$ZEC — honestly, the chart still says it is still tilted toward buyers because the recent price action is showing stronger bullish candles and higher lows near the established range floor. The flow on the fifteen-minute chart shows positive momentum despite the neutral daily picture. If it breaks decisively above the immediate swing high, that would be the key confirmation here.
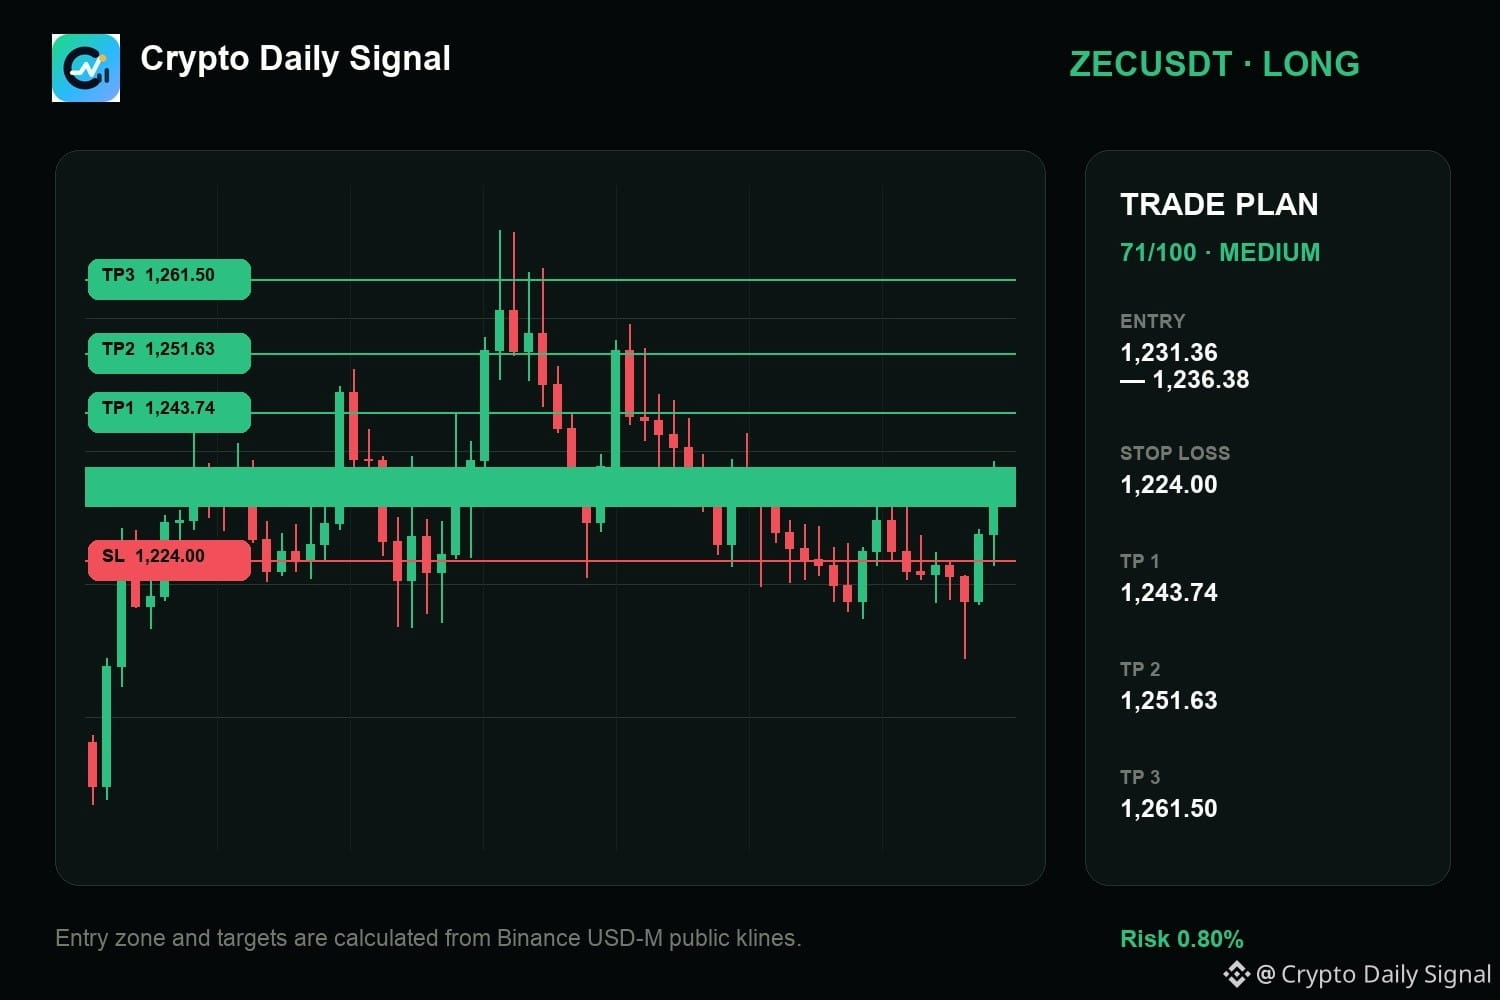
ZECUSDT LONG
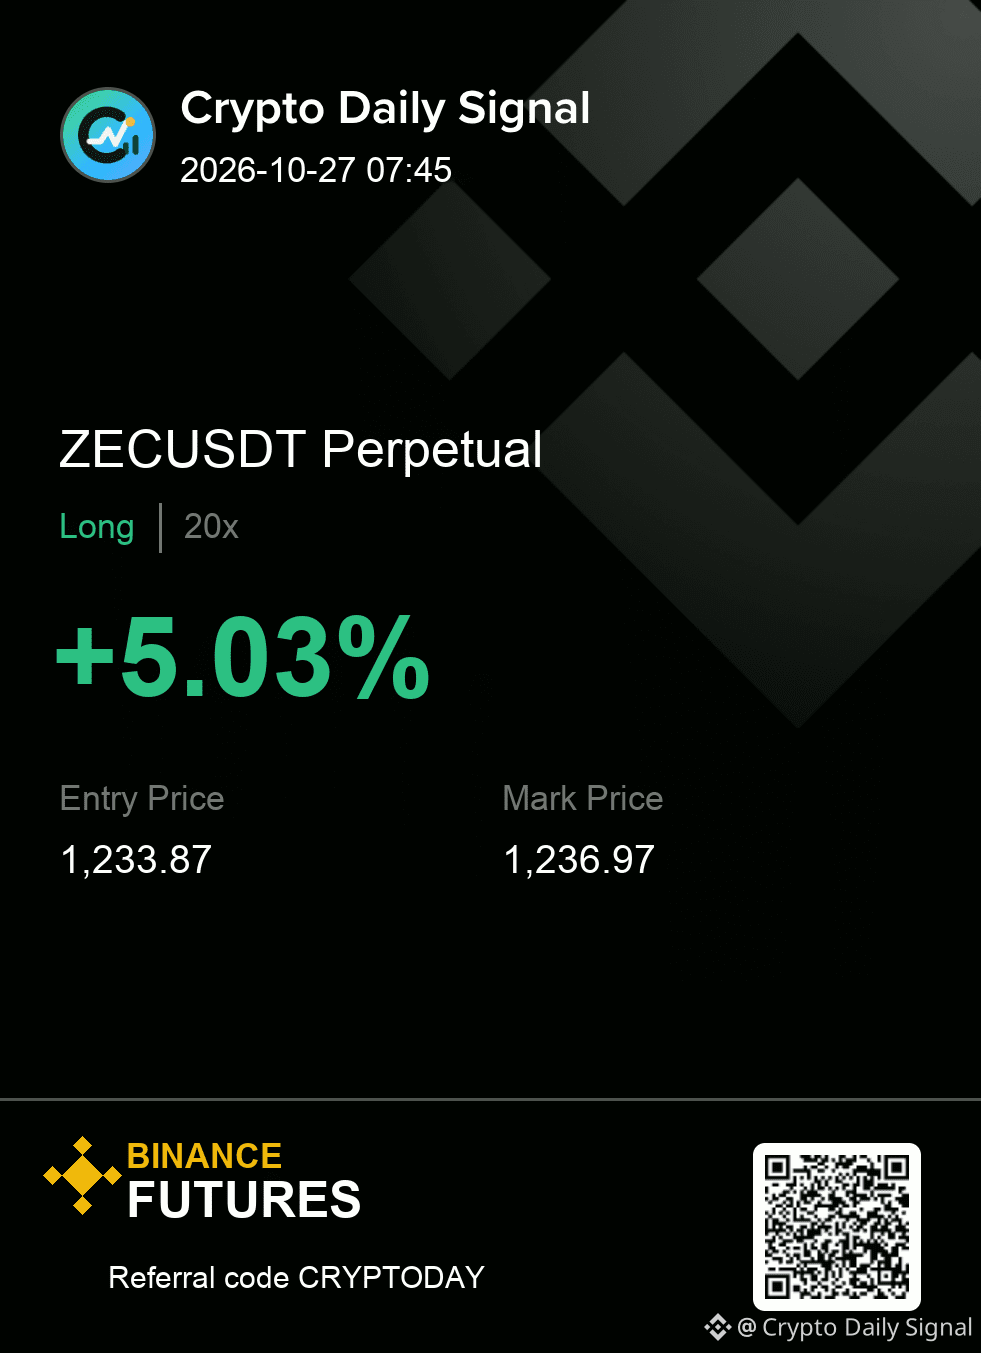
IN 1,231.36 - 1,236.38
OUT 1,224.00
TP 1,243.74 · 1,251.63 · 1,261.50
#TradingSignal
ZECUSDT LONG
IN 1,231.36 - 1,236.38
OUT 1,224.00
TP 1,243.74 · 1,251.63 · 1,261.50
#TradingSignal