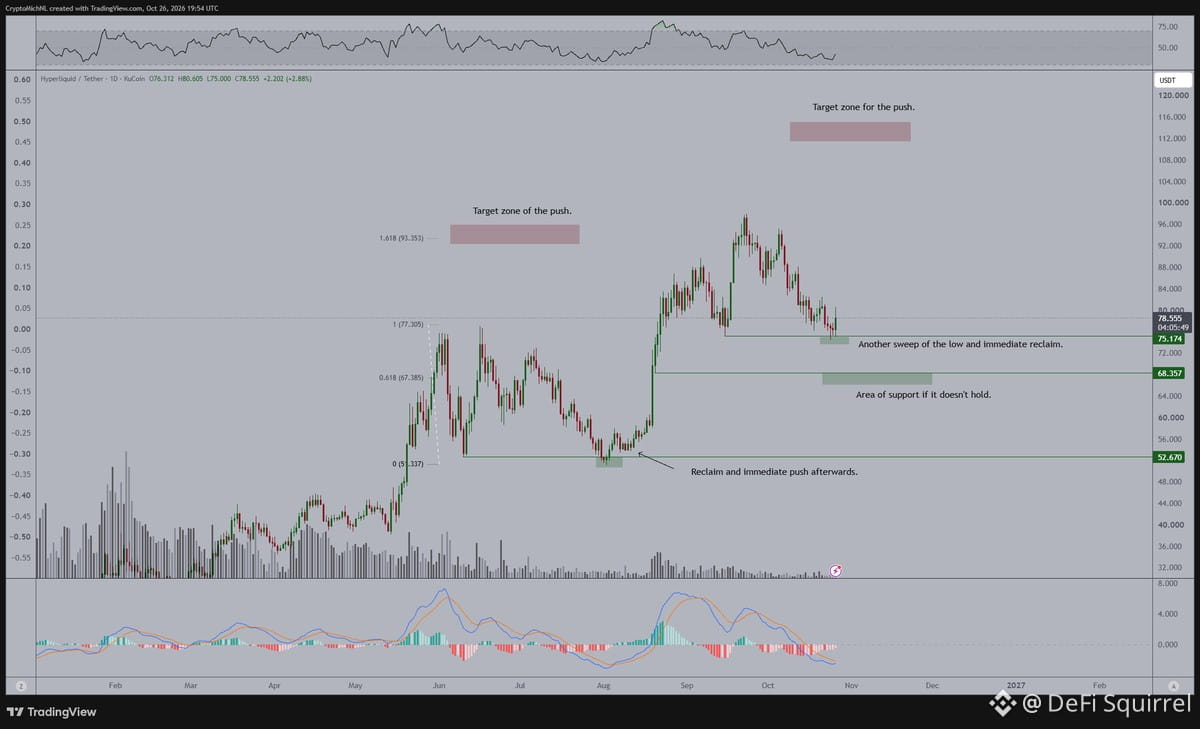
Looking at $HYPE and honestly, it's one of those charts where everything hinges on whether $BTC actually bottoms here or just keeps bleeding.
The pattern's kinda interesting though — back in August, $HYPE swept the lows and then ran. Now we're seeing similar price action sub-$75 in October. If this level holds, could be setting up for a move toward $110-120 over the next few months. Classic repeat behavior if you believe in these things.
But here's the thing — if it doesn't hold, I'm not chasing. Would look for entries under $68, ideally closer to $60 if we get that lucky. No point forcing it when $BTC's still figuring itself out.
It's all conditional. The chart looks decent, but charts don't mean much when macro's still shaky. Just watching and waiting like everyone else.