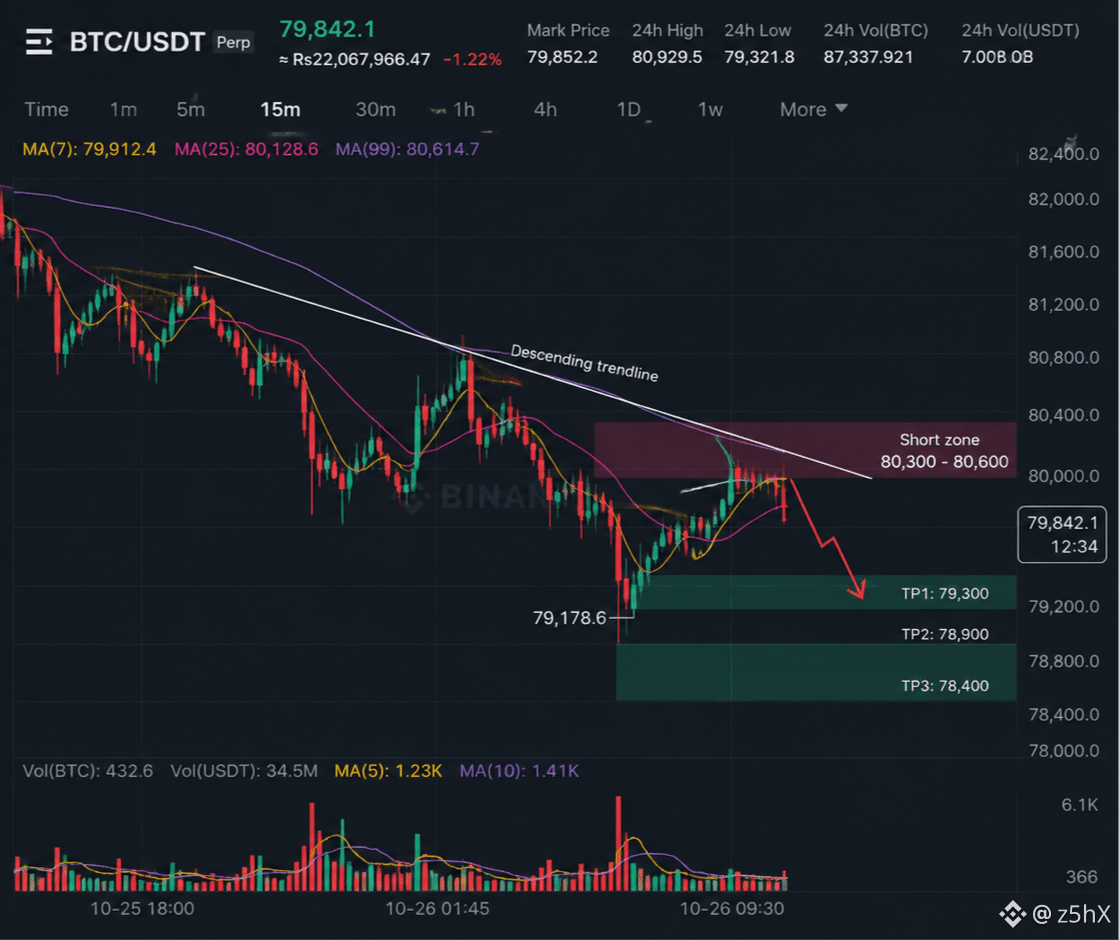
BTC MARKET WATCH Bears Still Have the Momentum But Watch This Level
Bitcoin is trading around $79,850 on the chart I reviewed, and the multi-timeframe structure currently leans bearish.
Here's what stands out:
4H STRUCTURE
BTC is trading below the 7,25 and 99 moving averages. The $80,200–$80,500 region is the first area I'm watching for potential resistance
DAILY STRUCTURE
Price remains below the 7-day and 25-day moving averages, while the 99-day average sits near $75,700.
KEY LEVELS
• Resistance: $80,200–$80,500
• Higher resistance: $80,900–$81,000
• Near-term support: $79,300
• Recent low: approximately $79,180
WHAT I'M WATCHING
Bearish scenario: A failed recovery into resistance followed by renewed selling pressure.
Bullish scenario: A sustained reclaim of resistance that weakens the current bearish structure.
Neither scenario is confirmed simply because price reaches a level. I want to see how price reacts before drawing conclusions.
No blind entries. No guaranteed targets. Risk first.
Question for traders: Are you watching for a continuation below $79,180, or a recovery above $80,500?
$BTC #Bitcoin #CryptoTrading #TechnicalAnalysis