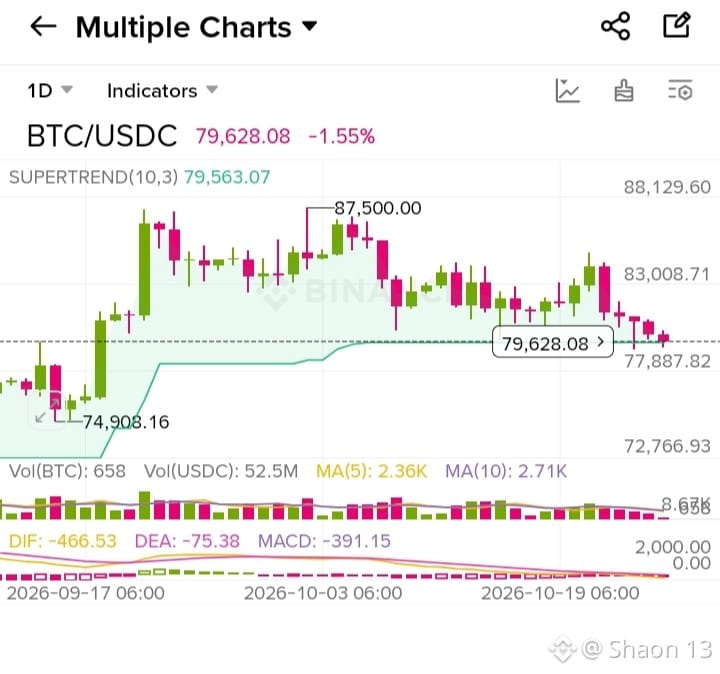
BTC/USDC Technical Analysis (1D Chart)
🔹 Current Price: $79,628.08 (-1.55%)
🔹 Trend Overview: The market is currently showing consolidation with a slight downward correction, hovering near a crucial support zone.
📊 Key Technical Indicators Breakdown:
Supertrend (10,3):
Level: $79,563.07
Analysis: Price is currently trading right around the Supertrend line, acting as an immediate psychological and technical pivot point. Holding above this level is vital for a bullish continuation.
MACD Indicator:
DIF: -466.53 | DEA: -75.38 | MACD Histogram: -391.15
Analysis: The MACD lines remain in negative territory with weak momentum, indicating that sellers are currently putting short-term pressure on the market, requiring patience before a strong reversal.
Moving Averages (MA):
MA(5): 2.36K | MA(10): 2.71K
Analysis: Volume moving averages reflect a cooling-off period following previous volatility near the local highs.
🎯 Key Levels to Watch:
Resistance: $83,008 – $87,500 (Breakout above this range could trigger a strong rally towards higher targets)
Support: $77,887 – $74,908 (Crucial demand zones to watch for potential bounce-backs)
💡 Market Sentiment: Neutral to Cautious. Keep an eye on volume changes and how the price reacts around the Supertrend support!
Disclaimer: This analysis is for educational purposes only and does not constitute financial advice. Always do your own research (DYOR) before trading.
Tags: #bitcoin #BTC #CryptoAnalysis" #BinanceSquareFamily #TechnicalAnalysise
$BTC $BTC