

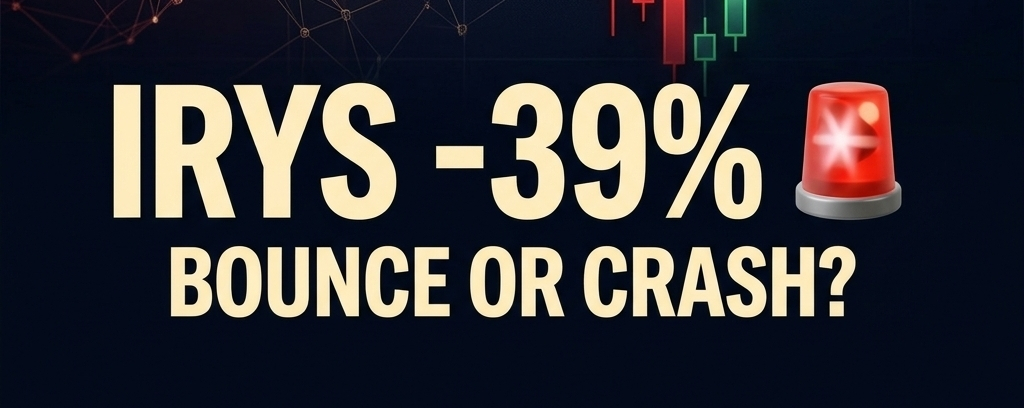

Irys (IRYS) is facing intense selling pressure after a dramatic market move. In the supplied Binance Futures screenshots, the token is trading around $0.0451, down nearly 39% in 24 hours, after reaching a high of $0.12827.
With trading volume surging, traders are watching closely: Is IRYS approaching a potential recovery zone, or is another leg down coming?
📊 Market Snapshot
Pair: IRYSUSDT Perpetual
Price: Approximately $0.0451
24H Change: Nearly -39%
24H High: $0.12827
24H Low: $0.04206
24H Volume: Approximately $846M USDT
⚡ 15-Minute (15m) Chart
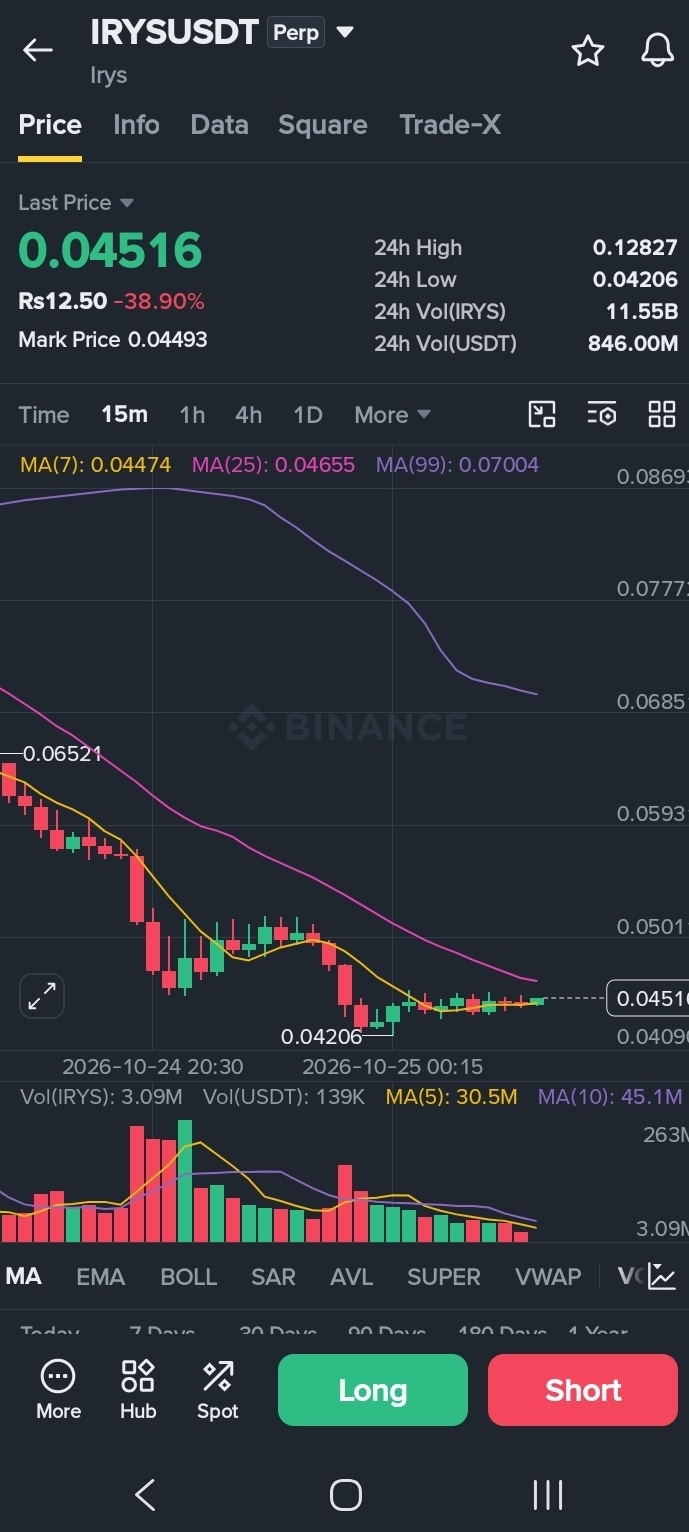
The 15m timeframe is useful for spotting immediate buying or selling pressure.
Key support: $0.04206
Immediate signal: Watch whether price stabilizes above the recent low.
Bullish sign: A recovery with stronger buying volume.
Bearish sign: A clean break below $0.04206.
A short-term bounce alone would not confirm a broader trend reversal.
⏱️ 1-Hour (1H) Chart
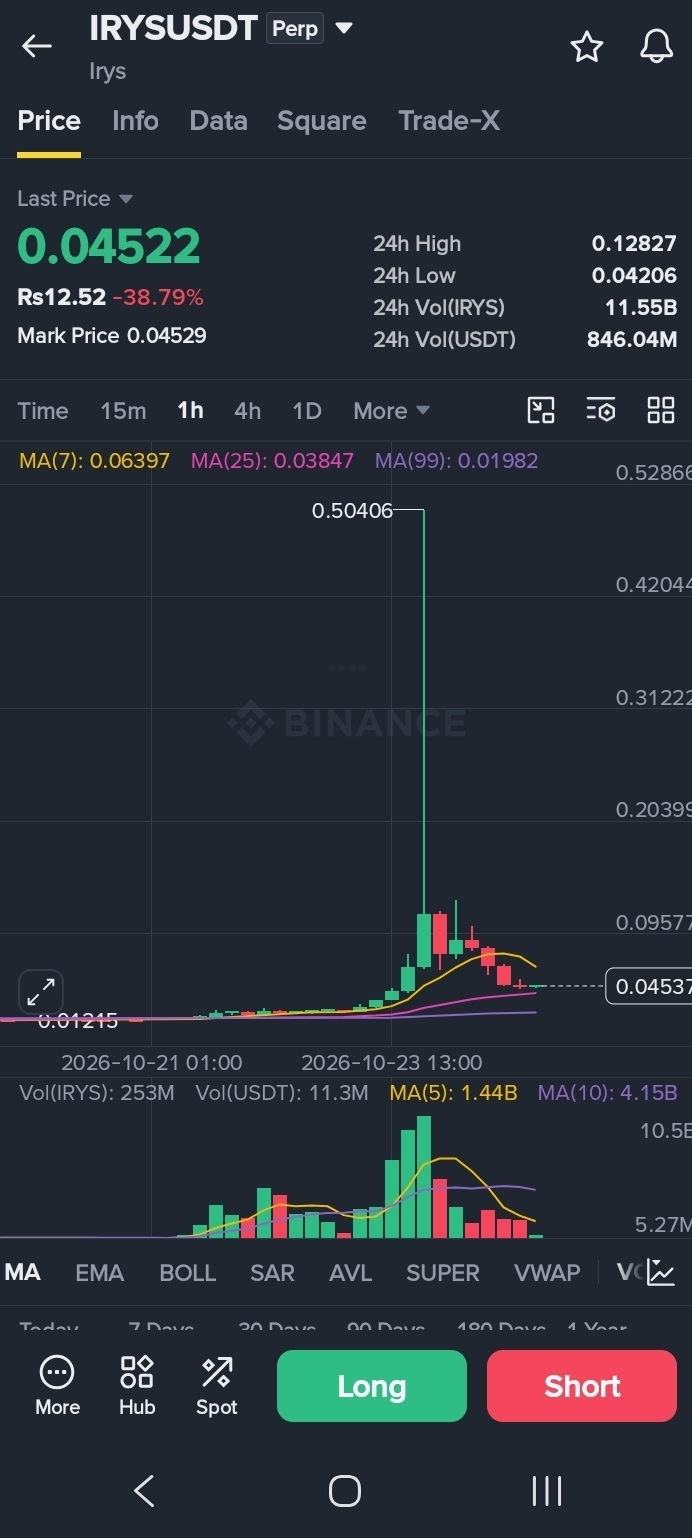
The 1H chart shows price near $0.04516.
MA(7): $0.04474
MA(25): $0.04655
MA(99): $0.07004
Support: $0.04206
Resistance: $0.04655, then $0.05011
Price is near the short-term MA(7), but remains below MA(25) and MA(99). Buyers would need to reclaim nearby resistance to strengthen the recovery case.
📉 4-Hour (4H) Chart
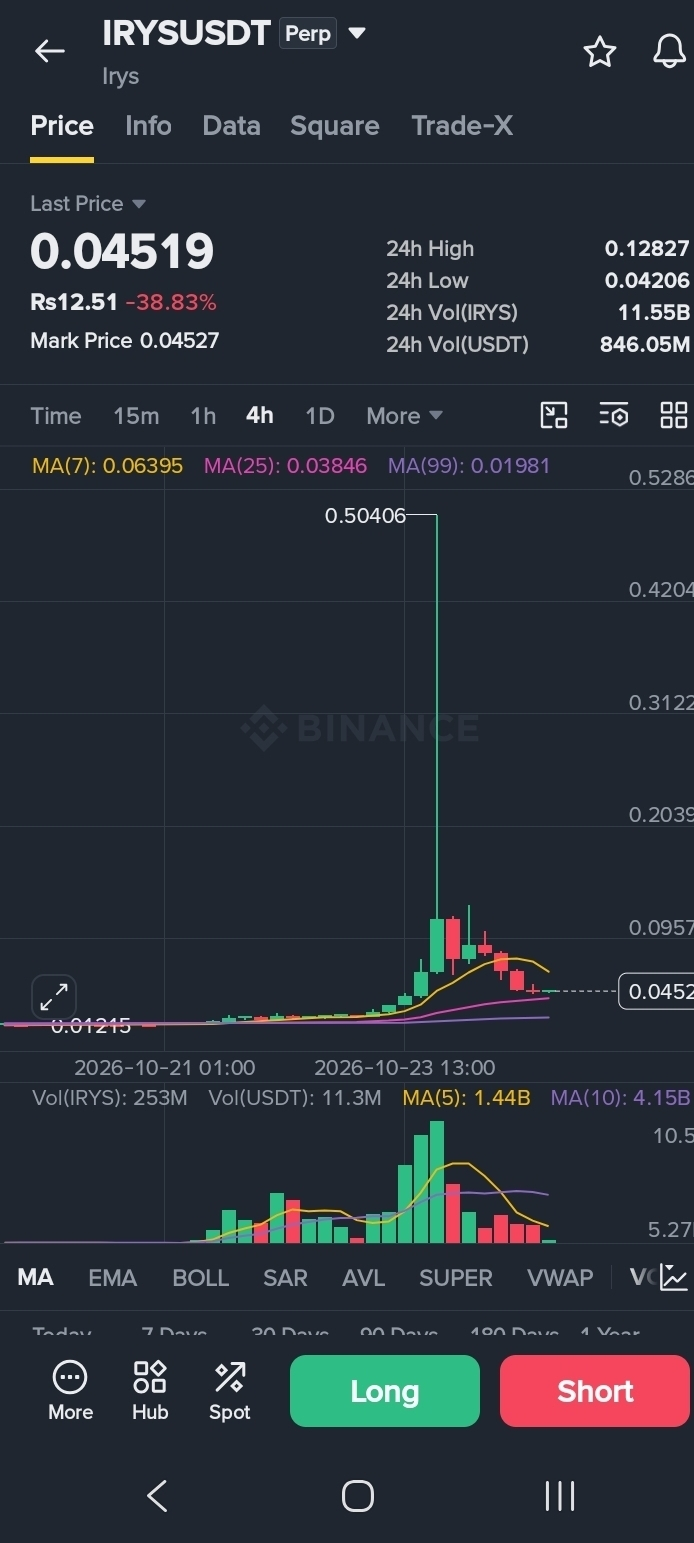
The 4H chart helps assess whether the sell-off is losing momentum or continuing.
Key level to defend: $0.04206
First recovery area: $0.04655–$0.05011
Important confirmation: A sustained recovery with stronger volume and higher lows.
The supplied screenshots do not show a clearly readable set of 4H moving-average values, so these should be treated as price areas to monitor, not confirmed signals.
📅 Daily (1D) Chart
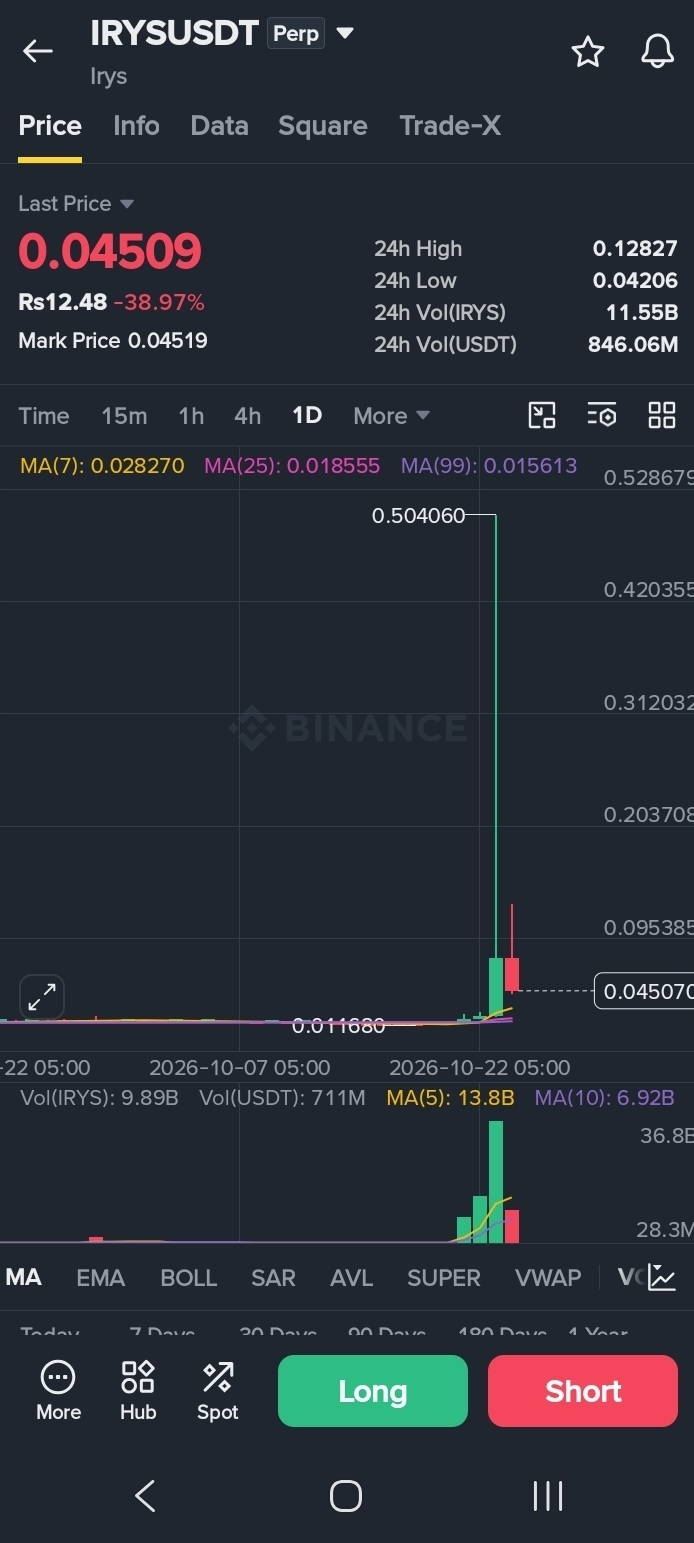
The daily chart highlights the scale of the recent decline.
MA(7): $0.06397
MA(25): $0.03847
MA(99): $0.01982
Recent low: $0.04206
Current price: Approximately $0.0451
Price is well below the daily MA(7), reflecting strong recent weakness, but remains above the displayed MA(25) and MA(99). The daily trend needs further confirmation; one sharp sell-off does not determine what happens next.
🗓️ Weekly (1W) Chart
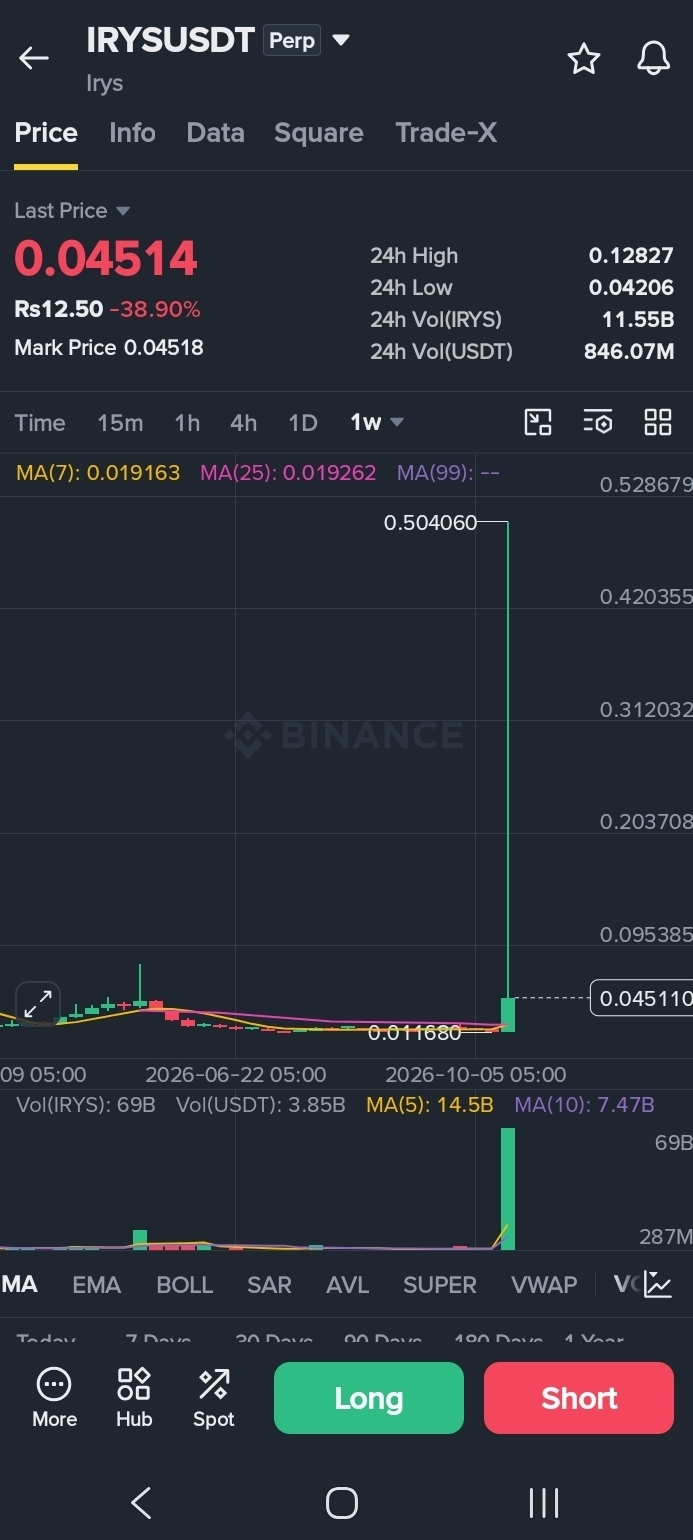
The weekly timeframe provides the bigger-picture context.
The supplied chart shows a major historical price expansion followed by a steep retreat. Weekly moving-average readings are not sufficiently clear to support a precise crossover or trend claim.
What to watch: Whether IRYS can stabilize and form a sustainable base, or whether selling continues across multiple weekly candles.
📆 Monthly (1M) Chart
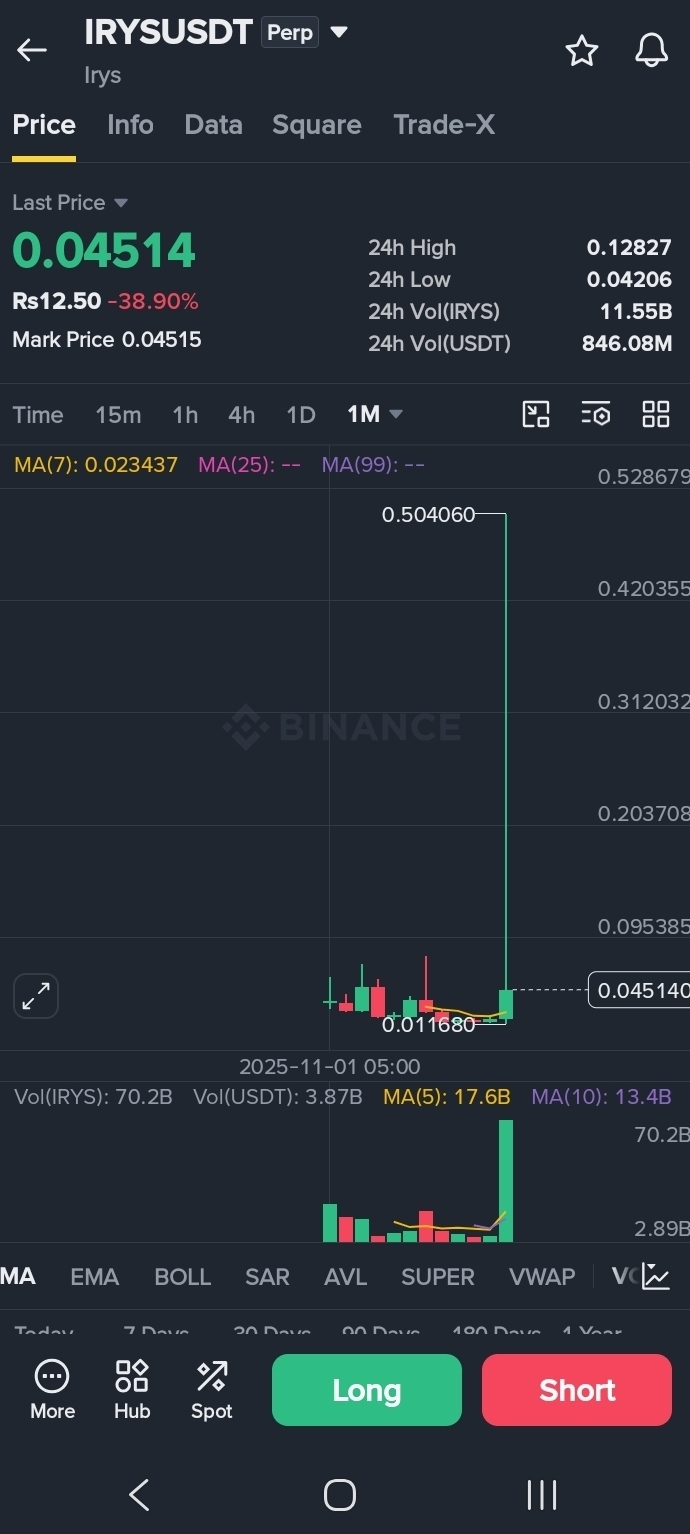
The monthly chart helps put the move into long-term perspective.
IRYS has experienced a wide price range since its earlier trading history. The latest decline is significant, but a single monthly snapshot cannot confirm a long-term bottom.
Key focus: Long-term price stabilization, sustained volume, and confirmation from future monthly candles—not simply a bounce after a crash.
🎯 Key Levels to Watch
$0.04206: Immediate support from the supplied 24-hour low.
$0.0447–$0.0466: Short-term moving-average area.
$0.05011: Nearby recovery level.
$0.06397: Daily MA(7), a higher resistance reference.
$0.12827: Previous 24-hour high.
🟢 Bullish Scenario
IRYS holds above $0.04206, recovers $0.04655, and sustains a move toward $0.05011 with stronger buying volume.
🔴 Bearish Scenario
IRYS breaks below $0.04206 and fails to reclaim it, increasing the risk of further downside.
💬 What’s Your Prediction?
After a nearly 39% drop, is IRYS preparing for a recovery—or could sellers push it lower?
Comment: BULLISH 🚀 or BEARISH 📉 — and tell us which timeframe you trust most!
Disclaimer: This analysis is based on the supplied Binance Futures screenshots, not a live market feed. Crypto futures are highly volatile and leveraged trading can cause rapid losses. These levels are not guaranteed and this is not financial advice.
#IRYS #Irys #CryptoAnalysis #BinanceSquare #CryptoMarket #Altcoins #TechnicalAnalysis_Tickeron