

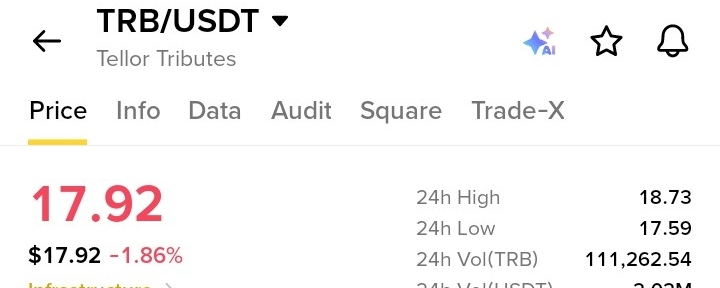

Tellor Tributes (TRB) is currently trading at $17.92, down 1.86% in the last 24 hours. The 24h high is 18.73 and the 24h low is 17.59.
📊 Daily Chart Analysis
Pump and dump: From late September to early October, TRB rallied sharply to $23.60. A big red candle followed, and price has since pulled back.
Moving averages: MA(7) = 18.06 (just above price), MA(25) = 19.15 (sloping downward), MA(99) = 16.93 (acting as support below).
Volume: Volume has dropped significantly since the peak. The market is uncertain right now, and neither buyers nor sellers are showing strength.
🎯 Key Levels
Support: 17.50, then 16.83–16.93 (MA99 zone), then 15.00
Resistance: 18.06–18.62, then 19.15 (MA25) and 20.40
⏳ Performance
7 Days: -1.65%
30 Days: -4.37%
90 Days: +22.81%
1 Year: -27.93%
🔍 Possible Scenarios
Bullish: If price closes a daily candle above 18.62 with rising volume, a rebound toward the 19–20 zone is possible.
Bearish: A close below 16.83 could lead to a test of support near 15.
⚠️ Risk Management
TRB is a relatively low-liquidity coin, so sudden and sharp price swings can happen. Always use a stop-loss and never put your entire capital into a single trade.
This is educational analysis only, not financial advice. Always do your own research (DYOR) before investing.
Where do you think TRB is heading next? Let us know in the comments 👇
#TRB #TellorTributes #Binance #BinanceSquare #BTC $TRB $BTC $ETH


