



$335M Liquidated The Market Is Punishing Both Sides
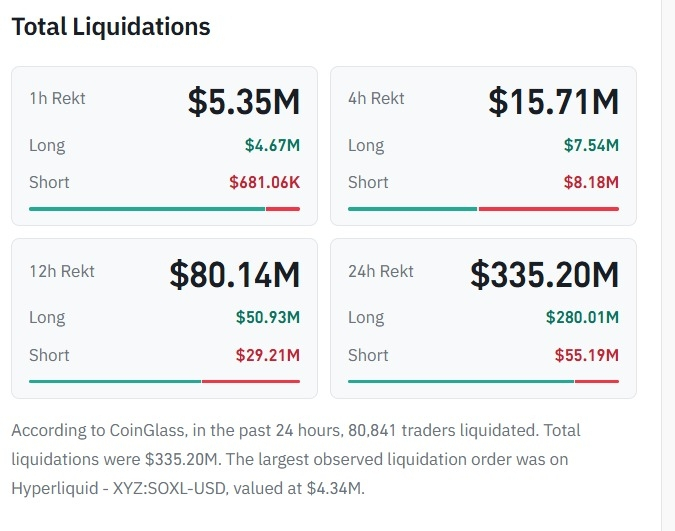
The latest liquidation data tells a bigger story than just red and green candles. According to the supplied CoinGlass snapshot, $335.20M in positions were liquidated over 24 hours, affecting 80,841 traders. But the breakdown reveals where the pressure is concentrated.
What the numbers reveal
• 24H liquidations: $335.20M
• Long liquidations: $280.01M
• Short liquidations: $55.19M
• 12H liquidations: $80.14M
• 4H liquidations: $15.71M
Long liquidations accounted for roughly 84% of the 24-hour total. That suggests leveraged bullish positions took the bigger hit during the period shown.
👀 Where the market gets interesting
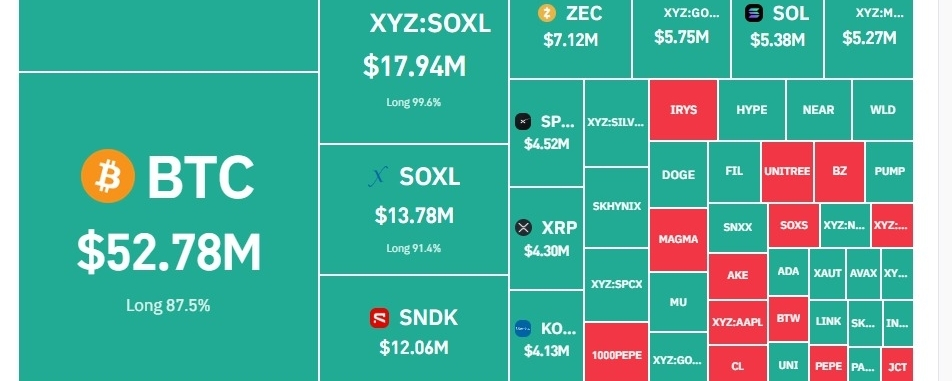
ETH recorded $59.40M in liquidations, while BTC saw $52.78M. Both heatmap blocks show a strong long-liquidation bias. $XAG $XAU $SOXL and other markets also appear prominently, showing that leveraged-position pressure was not limited to crypto.
However, the shorter timeframes tell a different story: shorts accounted for $8.18M of the $15.71M liquidated over four hours. This shift suggests that liquidation pressure can change quickly as price moves in either direction.
My market view: I would avoid blindly chasing a bounce or opening a fresh short just because longs were heavily liquidated. The key is whether BTC and ETH reclaim important resistance levels or continue making lower highs. A confirmed reclaim could trigger short liquidations, while another breakdown could put late dip-buyers at risk.
Liquidation data shows where leveraged traders were forced out, not where price must go next. I would wait for price-action confirmation and keep leverage under control rather than treating the heatmap as a standalone trading signal.
Risk management is essential. This is not financial advice; do your own research.