$AMZN
Range Play: Bulls Eye a Breakout
◆━━━━━━━━━━━━━━━━━━
Market Overview
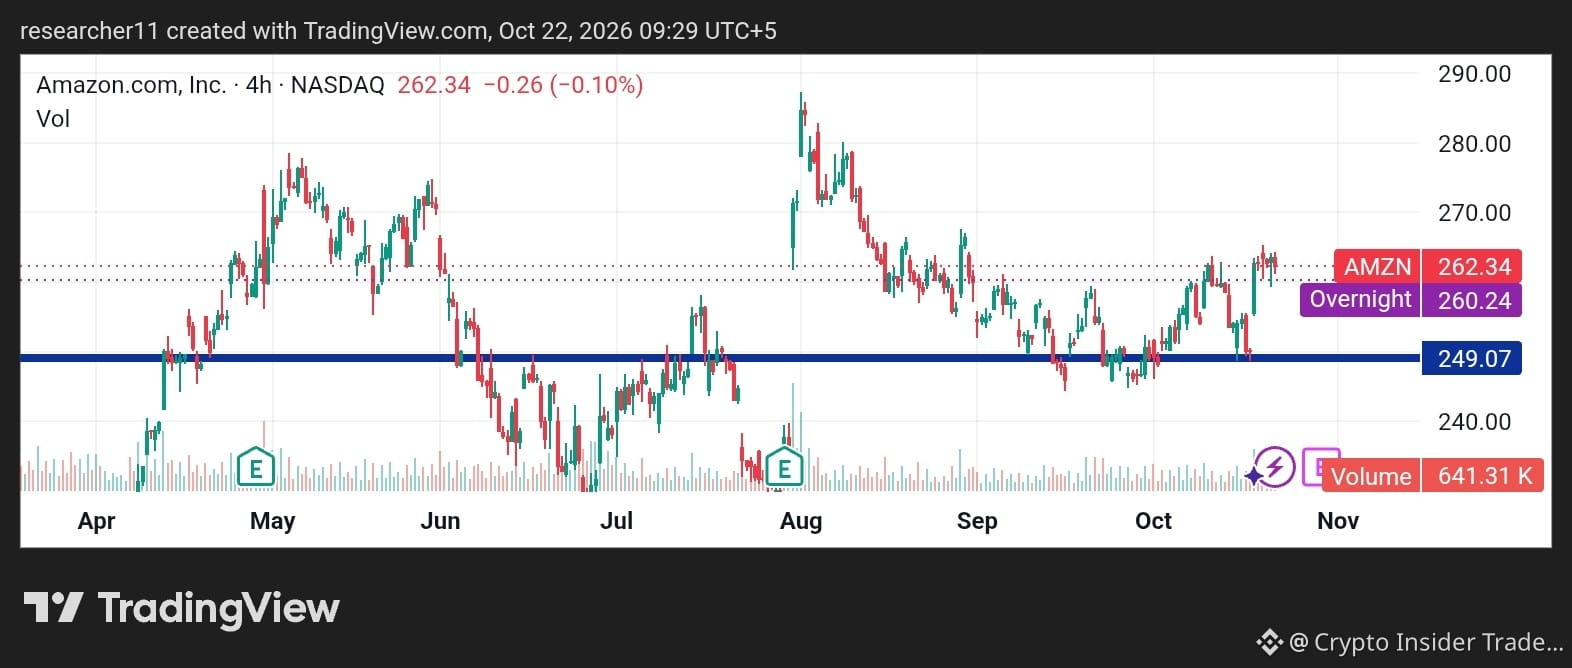
Amazon is trading near $262.34 (-0.10%) on the 4H chart, mostly flat after a strong recovery from the October lows near $245. The stock is consolidating below recent highs, and volatility has calmed after the big August spike toward $287.
◆━━━━━━━━━━━━━━━━━━
Technical Analysis
The $249.07 level is the key support base, where buyers defended price in late September and mid-October. Since then, price has formed higher lows and moved back toward the $265 area. The overnight level of $260.24 is acting as a minor support.
Resistance sits at $265, then $270, with the August peak near $287 as the major ceiling. Volume remains average, showing the market is still waiting for a catalyst.
◆━━━━━━━━━━━━━━━━━━
Scenarios
🟢 Bullish Case: A 4H close above $265 with strong volume could open the way to $270 and higher.
🔴 Bearish Case: A drop below $260 weakens momentum, and a break under $249.07 shifts the bias bearish.
⚪ Neutral Case: Sideways action between $249 and $265 as traders wait for direction.
◆━━━━━━━━━━━━━━━━━━
Key Levels
🔺 Resistance: R1 $265 | R2 $270
🔻 Support: S1 $249.07 | S2 $240
◆━━━━━━━━━━━━━━━━━━
Outlook
AMZN is building a base with improving structure. Watch $265 closely, as acceptance above it could shift momentum. Until then, range discipline is key.
For informational purposes only. Not financial advice.