


XRP price is back above $1.33 after pumping roughly 2.5% over the past 24 hours, and one of the analysts we regularly cover, CasiTrades, is now watching a much higher level before declaring the correction finished.
Her latest question is simple:
“Will price break above $1.65 to confirm the bottom is in!?”
That may sound far away from current price, but her daily XRP/USD chart explains why $1.65 is so important.
CasiTrades Says $1.65 Is the Real Confirmation Level
The chart shows the XRP price rebounding from the $1.25-$1.26 region, which lines up closely with the 61.8% Fibonacci retracement around $1.2588.
That area has become the key lower support in the current structure.
The recent rebound has now brought XRP back above the 11.8% retracement around $1.304, with price near $1.334 when the chart was published.
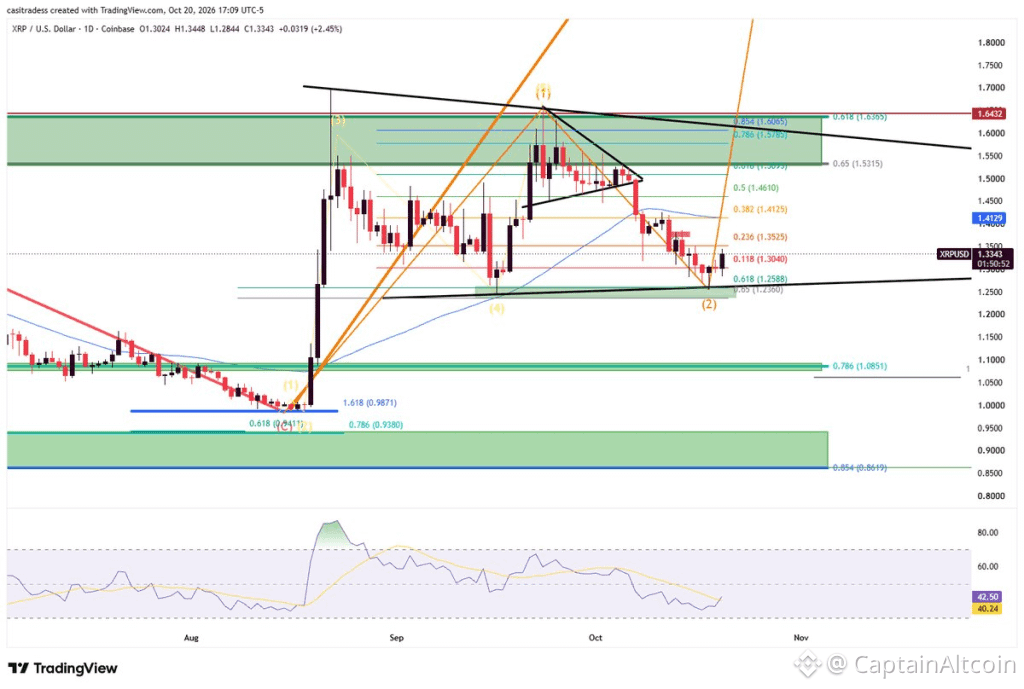
Above current price, the next Fibonacci levels are clearly marked:
$1.3525 around the 23.6% retracement
$1.4125 around the 38.2% level
$1.461 around the 50% level
roughly $1.53 around the 61.8%-65% region
$1.576-$1.606 around the 78.6%-85.4% zone
$1.6365 near the upper retracement boundary
That upper cluster leads directly into CasiTrades’ $1.65 confirmation level.
Her logic appears to be that the XRP price can bounce several times inside this broader corrective structure without actually proving that the bottom is complete.
A decisive move above $1.65 would do something different: it would break beyond the recent corrective highs and clear the upper resistance structure.
The XRP Chart Still Has a Lot of Work Ahead
I like the clarity of this setup.
It avoids calling $1.25 the bottom just because price bounced once.
XRP still has to reclaim several levels first.
The initial test is around $1.35.
Above that, $1.41 becomes more meaningful because it also lines up with a visible moving average on the chart.
Then comes the $1.46-$1.53 region, which is where the recovery would start looking much more serious.
Only after the XRP price gets through roughly $1.60-$1.65 would I agree that the probability of the bottom being established increases considerably.
There is also a broader descending resistance line above price, which adds another obstacle near the $1.60 area.
So this is not a clean runway.
What Happens If XRP Price Fails Again?
The downside structure is just as important.
The $1.2588 Fibonacci level has already acted as support.
Below that, the chart marks another area around $1.236.
If XRP loses that zone, the bullish recovery weakens quickly.
Further down, CasiTrades’ chart shows deeper Fibonacci support around $1.085 and then approximately $0.94-$0.86.
I would not jump immediately to those levels unless $1.25 breaks decisively, but they show how much downside remains technically possible if the current rebound fails.
RSI is also only around 42.5, with its average near 40.2.
That tells me momentum is improving, but XRP is nowhere near an overheated condition. There is room for a stronger recovery if buyers keep pushing.
My view is that $1.65 is a sensible confirmation level, but the first useful evidence comes much earlier.
If XRP can reclaim $1.41, then $1.46-$1.53, the recovery starts building structure.
Until then, the move from $1.25 to $1.33 is encouraging, but I would still call it a rebound inside a broader correction rather than proof that the bottom is definitively in.
For more crypto news and price predictions, click here.
Subscribe to our YouTube channel for daily crypto updates, market insights, and expert analysis.
The post XRP Price Needs to Break THIS Level to Confirm the Bottom is In! appeared first on CaptainAltcoin.