


XRP suffered its worst weekly performance among six major cryptocurrencies, falling as exchange activity and weaker performance against Bitcoin drew attention.
XRP Falls Behind Five Major Cryptocurrencies
According to News, $XRP has declined by 6.06% from October 10 to October 16, 2026. Bitcoin fell 1.25%, Ethereum lost 2.60%, and BNB declined 2.83%. Solana traded -4.35% while Dogecoin was down -5.22% in the same time.
Bitcoin's weekly decline was almost 5 percentage points less than the decline in XRP. Dogecoin came closest, losing 0.84 percentage points less than XRP. Among the six assets listed, XRP recorded the weakest weekly result.
The market chart for XRP revealed that it had dropped 0.73% over the previous 24-hour period to $1.29. It had a market cap of $81.77 billion and traded $1.16 billion a day. The displayed volume figure was down 22.72%.
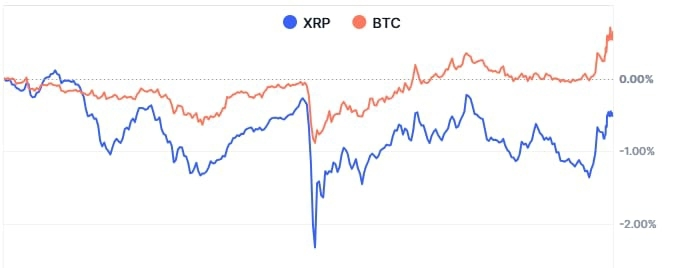
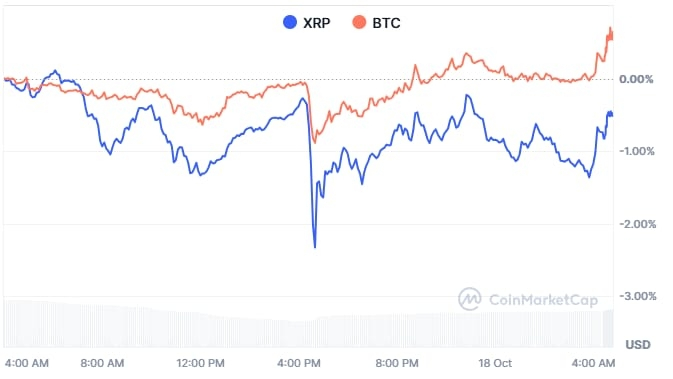
The hourly comparison against Bitcoin showed XRP falling sharply around 4:00 PM. Its relative performance briefly dropped below minus 2%, followed by a partial rebound. Bitcoin recovered more firmly, leaving XRP below its performance line for much of the session.
Exchange Data Shows Repeated Outflows
The spot-flow chart shows the inflow and outflow of XRP per day from December through October. Red bars appear frequently, showing days when outflows exceeded incoming deposits. Some of the deepest negative readings occurred in January, with further withdrawals appearing over subsequent months.
Green bars mark days when exchange deposits exceeded withdrawals. These appeared at intervals throughout the chart, including January, March, May, August, September, and October. The largest visible October spike approached $40 million.
The figures shown on the two panels are not directly comparable because they are on different scales. Exchange transfers can reflect several activities, not simply plans to buy or sell. The flow data alone cannot establish what individual holders intend to do.
XRP Needs a Stronger Price Recovery
The orange price line shows XRP declining through much of the period. It approached $0.90 in August before climbing towards $1.50 later that month. Prices then moved unevenly around 1.30–1.50 before the latest weakness.
Repeated exchange outflows may reduce the amount of XRP readily available for trading. However, withdrawals do not prove that holders intend to retain their coins. The occasional inflow spikes also show that deposits continue despite the frequent negative readings.
XRP's weekly performance and its hourly
comparison with Bitcoin both show relative weakness. A sustained price recovery would help establish whether buyers are returning. Until then, the recent losses remain the clearest evidence of its position against major peers.
Trading volume deserves attention after the reported 22.72% daily decline. Lower activity does not mean that prices will necessarily move in a negative direction. More volume with higher buying would give better proof of the resurgence of demand.
For now, XRP has recorded the largest weekly loss in the supplied comparison. Bitcoin's smaller decline and the mixed exchange-flow readings offer further context for the recent move. Whether XRP recovers or falls further will depend on subsequent trading, not the weekly figures alone.