



Bitcoin is trading around $82,884, up approximately 0.88% over the last 24 hours. BTC has recovered from its recent low of $80,684, but the next move depends on whether buyers can break nearby resistance or sellers regain control.
Looking across the 15-minute, 1-hour, daily, weekly and monthly timeframes, Bitcoin presents a mixed picture: short-term recovery, important overhead resistance and a broader trend that still needs confirmation.
📊 Market Overview
Current Price: $82,884
24H Change: +0.88%
24H High: $83,158
24H Low: $80,684
24H Volume: Approximately $1.06B USDT
⏱️ 15M Timeframe — Immediate Price Action
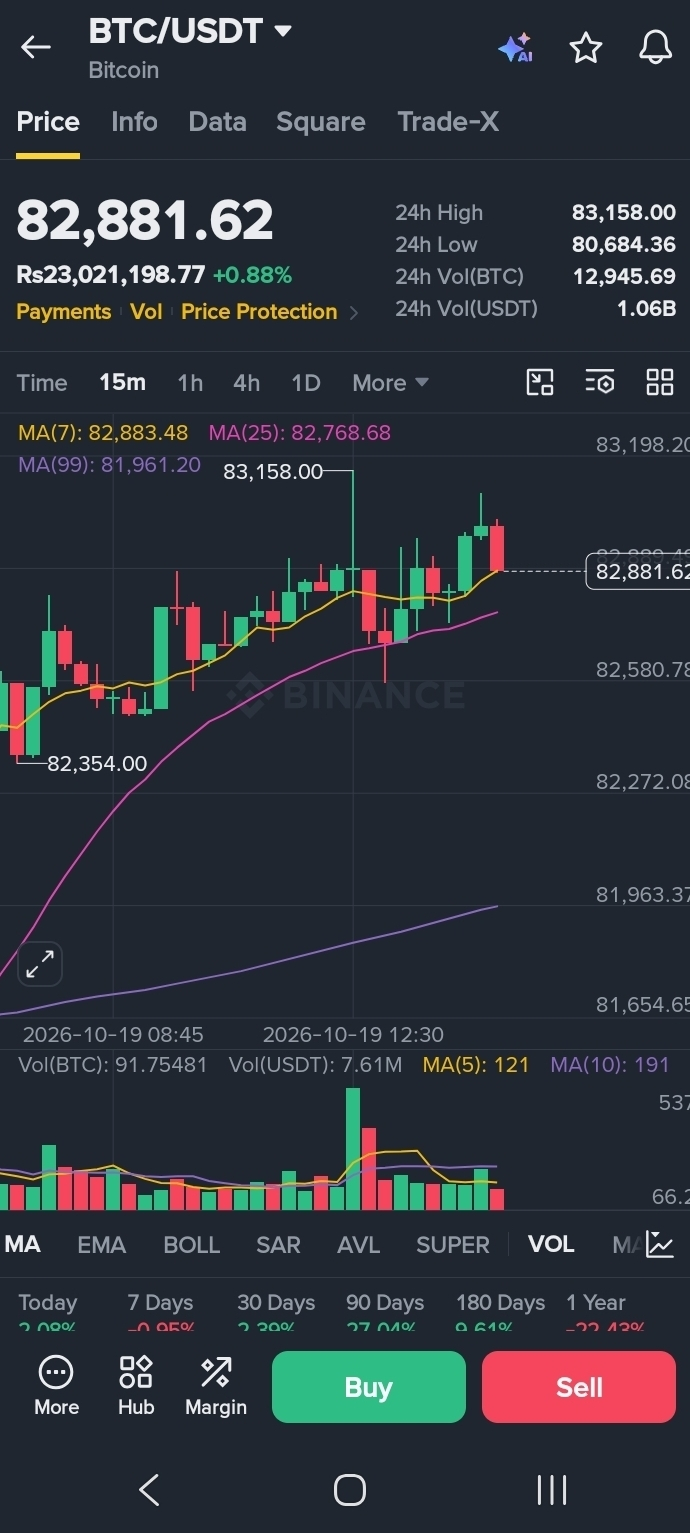
The supplied 15-minute chart shows:
MA(7): $82,883.48
MA(25): $82,768.68
MA(99): $81,961.20
BTC is near its short-term MA(7) and above MA(25) and MA(99). This suggests that immediate momentum is attempting to stabilize, but buyers still need a clear breakout above $83,158–$83,200.
A drop below $82,768 could weaken the short-term setup.
⏱️ 1H Timeframe — Recovery in Progress
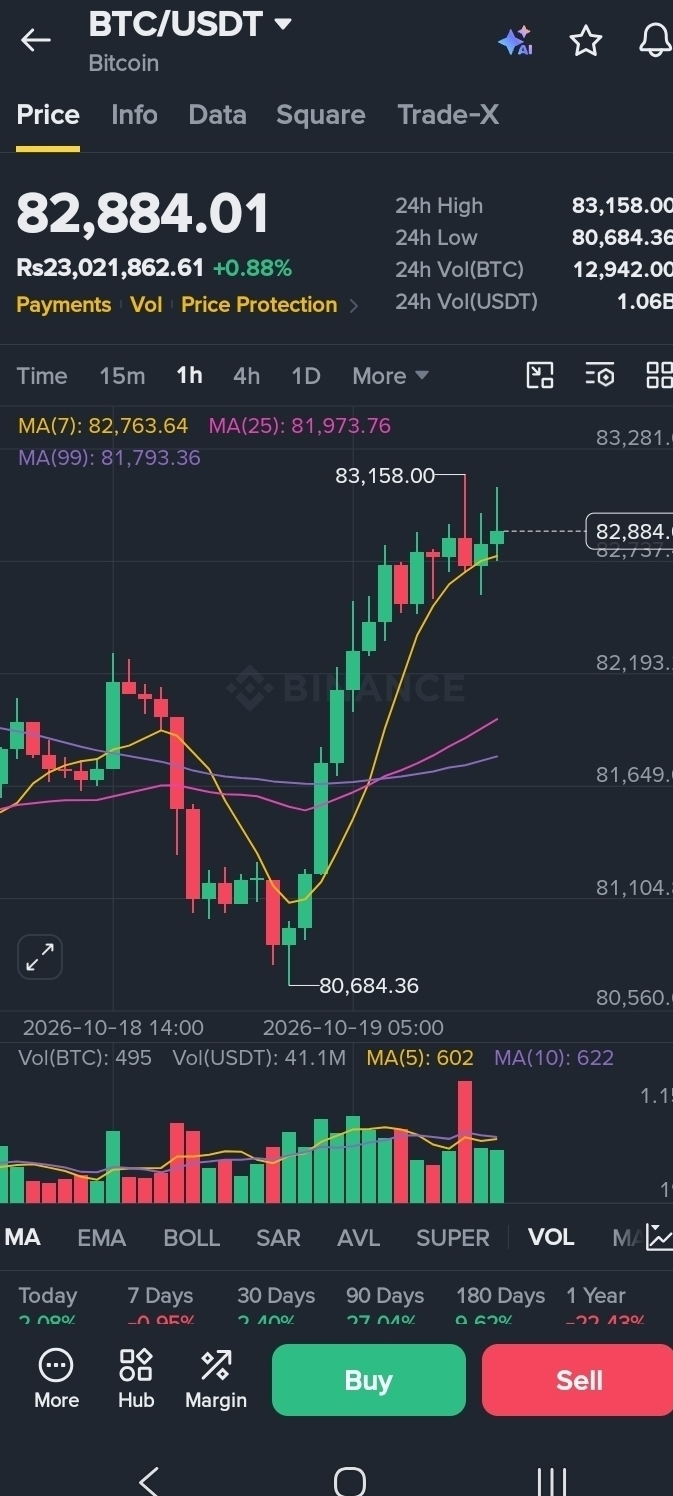
The 1-hour chart shows:
MA(7): $82,763.64
MA(25): $81,973.76
MA(99): $81,793.36
BTC is trading above all three moving averages, indicating a stronger short-term recovery. However, resistance near $83,158–$83,300 remains a key hurdle.
A sustained breakout could open the way toward $83,800, while rejection may bring $82,200–$81,970 back into focus.
📅 1D Timeframe — Resistance Remains Important
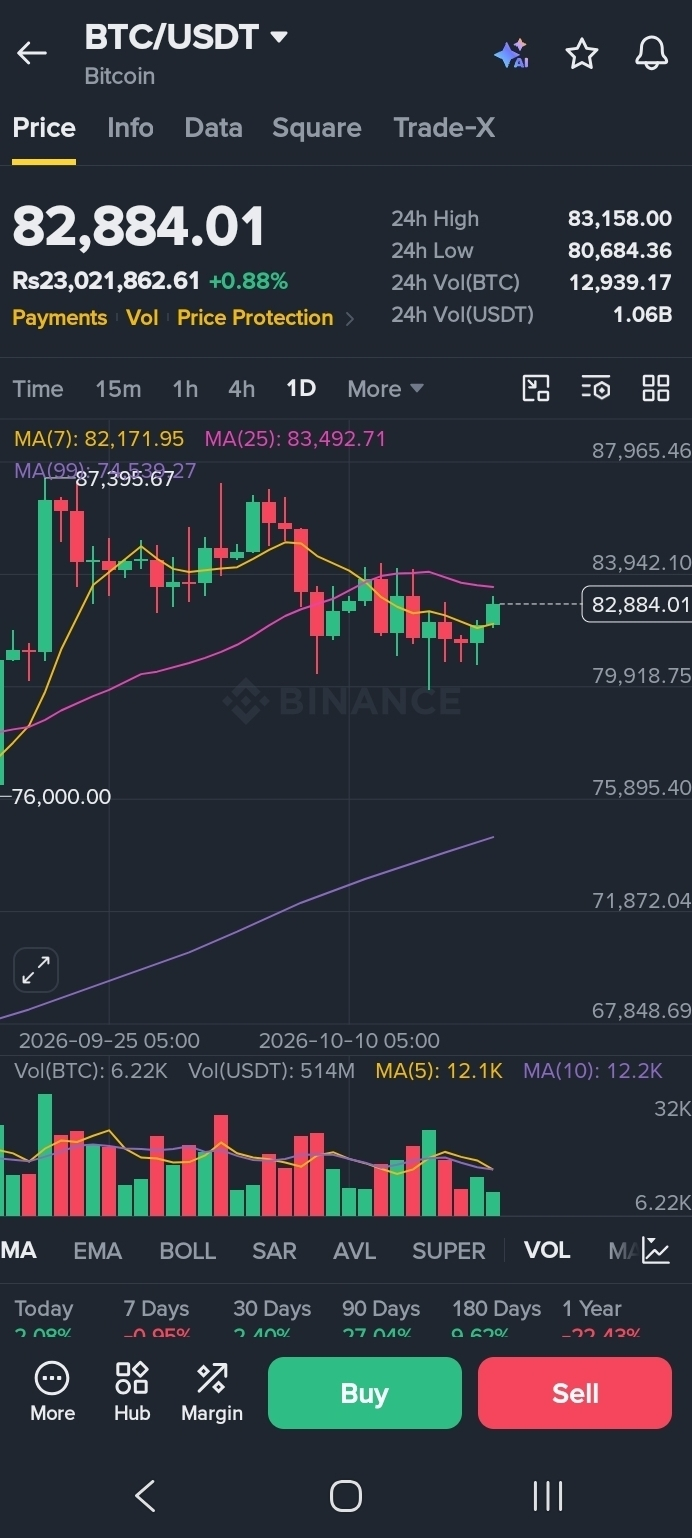
The daily chart shows:
MA(7): $82,053.63
MA(25): $81,879.83
MA(99): $83,269.71
BTC is above MA(7) and MA(25), but below MA(99). This indicates a recovery that has not yet fully confirmed a bullish reversal.
A daily move above $83,270 would improve the outlook. Failure to reclaim this level could keep selling pressure in play.
📈 1W Timeframe — Broader Trend Check
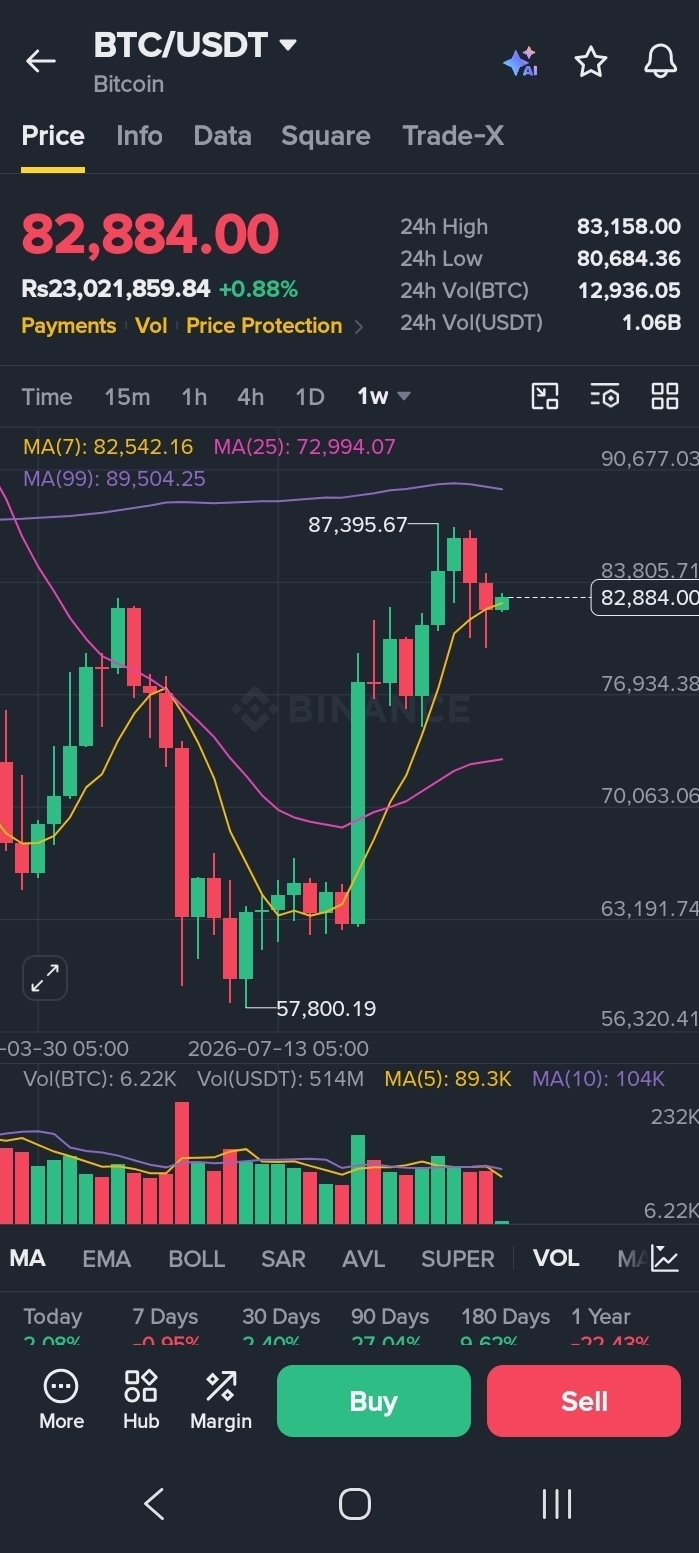
The weekly chart shows:
MA(7): $82,542.16
MA(25): $72,994.07
MA(99): $89,504.25
BTC is above the displayed MA(7) and MA(25), but below MA(99). This points to a mixed broader structure: price is holding above shorter-term weekly averages, while the longer-term average remains overhead.
The $83,800 area is an initial level to monitor, while $89,500 is a significant longer-term moving-average reference—not an immediate price target.
🌐 1M Timeframe — Long-Term Perspective
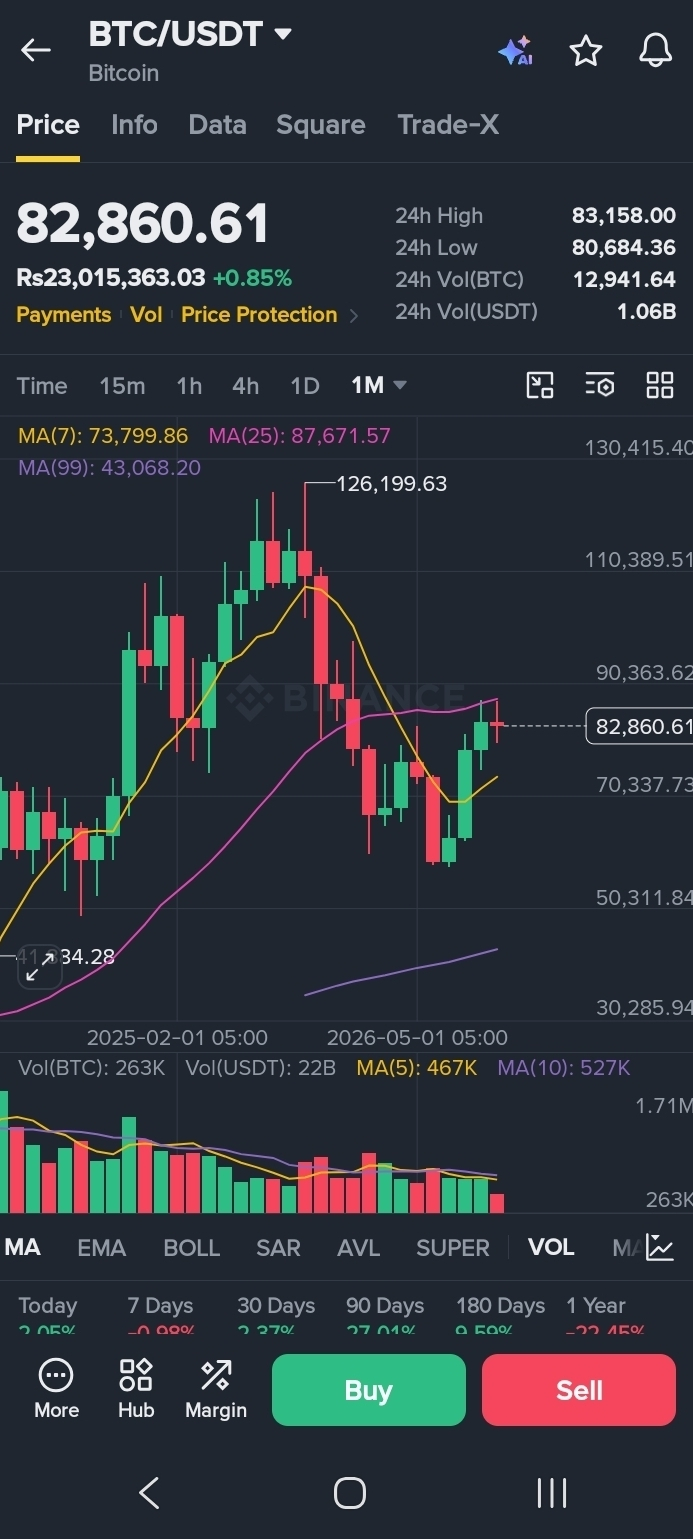
The monthly chart shows:
MA(7): $73,799.86
MA(25): $87,671.57
MA(99): $43,068.20
BTC is above MA(7) and MA(99), but below MA(25). This suggests that the long-term structure has supportive elements, although the price remains below an important monthly moving average.
A sustained recovery above $87,671 would strengthen the longer-term picture. These monthly averages are broad trend references, not precise entry signals.
🎯 Key BTC Levels to Watch
Resistance
$83,158–$83,300
$83,800
$84,100
$87,671–$89,504 (higher-timeframe references)
Support
$82,768
$82,200
$81,970–$81,790
$80,684
🔍 Final Outlook: Bullish Recovery or Another Rejection?
Bullish scenario: BTC breaks above $83,300 and holds the level with stronger volume. This could bring $83,800 into focus, followed by higher resistance zones if momentum continues.
Bearish scenario: BTC fails to break resistance and falls below $82,768, increasing the possibility of a move toward $82,200 and $81,970. A break below $80,684 would signal additional weakness.
Overall view: The 15M and 1H charts show signs of recovery, while the 1D, 1W and 1M charts highlight important resistance and a mixed broader structure. Confirmation across timeframes is more reliable than relying on one chart alone.
What do you think? Will Bitcoin break above $83,300, or will sellers push BTC back toward $82,000?
Disclaimer: This article is for educational purposes only and is not financial advice. Cryptocurrency markets are volatile, and leveraged futures trading carries a substantial risk of loss. Always conduct your own research and manage risk carefully.
#Bitcoin #BTC #CryptoAnalysis #BinanceSquare #BTCUSDT