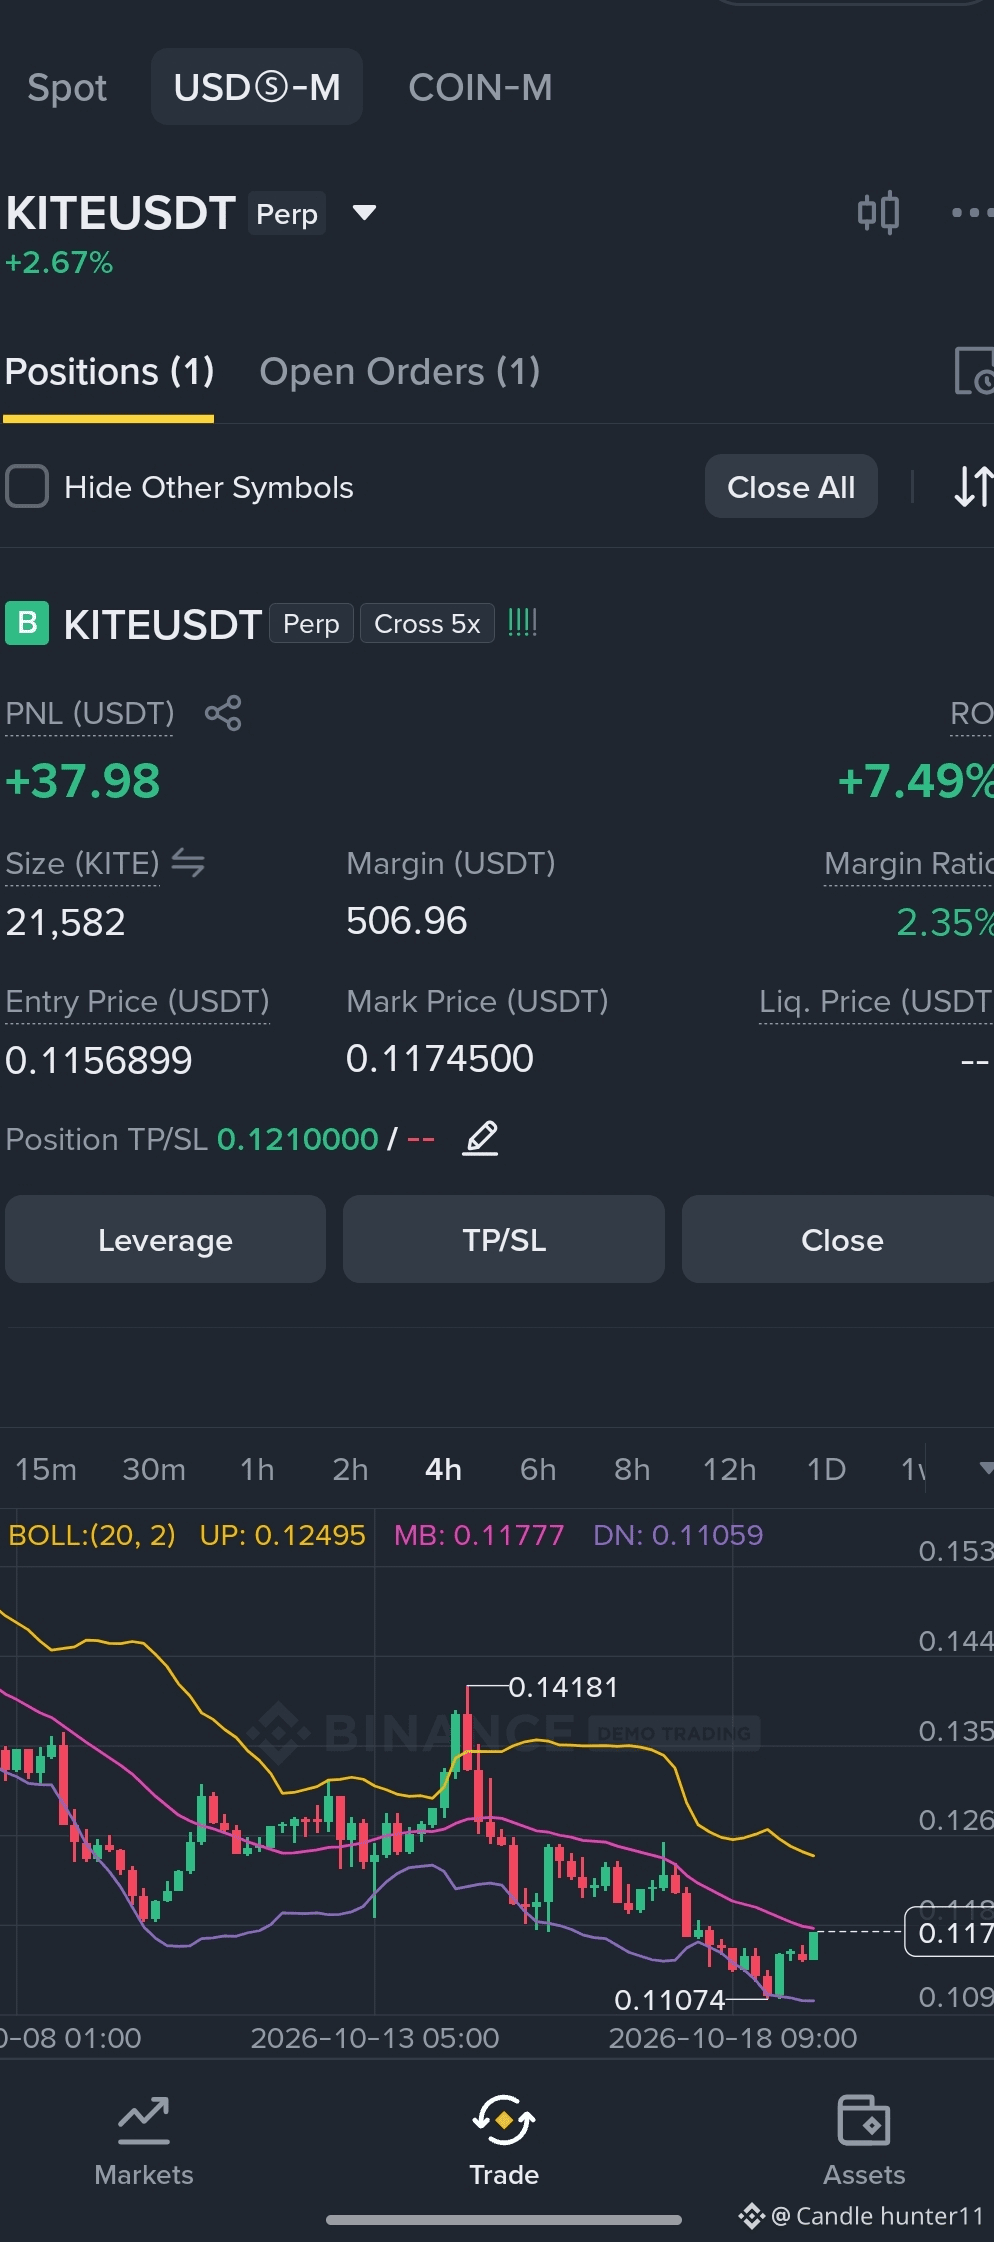
🚀 KITEUSDT FUTURES SIGNAL | BULLISH RECOVERY?
📊 Trading Pair: KITE/USDT
⏱️ Timeframe: 4H
🟢 Bias: Short-term recovery attempt
📈 Position: Long
💰 Entry Zone: $0.1155–$0.1160
🎯 TAKE-PROFIT TARGETS
🥇 TP1: $0.1190
🥈 TP2: $0.1210
🥉 TP3: $0.1240
🛑 STOP-LOSS: $0.1095 (below recent swing support; reassess if volatility increases)
📊 TECHNICAL ANALYSIS
KITE is attempting a recovery after dropping to approximately $0.1107. The 4H chart shows a small rebound, but price remains near the Bollinger middle band at $0.11776 and below the upper band at $0.12494.
🔹 Support: $0.1105–$0.1110
🔹 Resistance: $0.1178, $0.1210, and $0.1250
🔹 Bullish confirmation: A 4H close above $0.1178, followed by a successful retest
🔹 Bearish warning: A breakdown below $0.1105 could invalidate the recovery setup
⚠️ RISK MANAGEMENT
The setup is not fully confirmed. Avoid adding to a losing position just because leverage is available. At 5x cross leverage, protect your capital and account for fees and slippage.
🔥 Can KITE break $0.1210 and move toward $0.1250?
Comment your targets and share your chart analysis! 👇
#KITE #KITEUSDT #CryptoSignals #BinanceFutures #TechnicalAnalysis #CryptoTrading
Disclaimer: Educational analysis based on the provided chart, not financial advice. Confirm levels against the live market before trading.